


 Major Pair Action Bias: Extremely Bullish Surge Powers GBPUSD & NZDUSD as Bullish Momentum Ignites
  AUDJPY Bullish Surge: Strong Australian Dollar Fuels Fresh Upside as Pair Holds Above 113.50 and All EMAs Align
  FxWirePro: GBP/NZD downtrend loses steam, remains on bearish path
  FxWirePro:EUR/NZD dips below lower range, bearish bias increases
  FxWirePro: USD/ZAR advances as South African rand weakens amid renewed Middle East tensions
  FxWirePro: NZD/USD trades in narrow range ,outlook bullish
  FxWirePro- Major Pair levels and bias summary
  FxWirePro- Major Pair levels and bias summary
  FxWirePro: GBP/USD under pressure despite UK's modest economic growth
  JPY Action Bias: Extremely Bullish Surge Ignites Across NZD, GBP & AUD
  FxWirePro: GBP/NZD gains some upside momentum but still bearish
  FxWirePro:EUR/NZD stuck In narrow ranges, focus on near term support
  FxWirePro: EUR/AUD outlook weaker on renewed downside pressure
  FxWirePro: AUD/USD edges lower, but bullish outlook persists


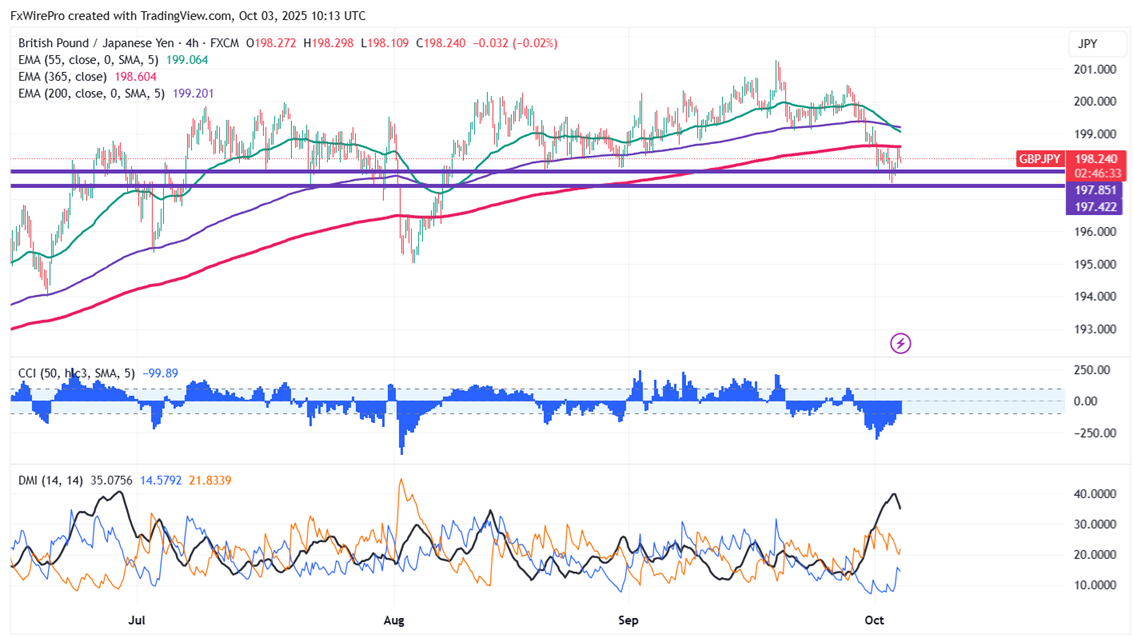
As the yen loses steam, GBPJPY climbed almost 100 pips from the small bottom of 197.48. Currently trading around 198.19, the pair reached an intraday high of 198.55.
Oscillators and moving averages to forecast the trend of GBPJPY
CMP- 198.08
EMA (4-hour chart)
55-EMA- 199.09
200-EMA- 199.21
365-EMA- 198.60. The pair trades below short and above long long-term moving average.
This week's low- 197.48 (Yesterday’s low). The pair holds well below that level. Any breach below 197.45 will drag the pair down to 196.95/195.80/195.80/195.
Recent high - 198.60. Any break above 198.63 confirms minor bullishness, a jump to 199.20/199.60/200 /200.51is possible.
Indicator (4-hour chart)
CCI (50)- Bearish
Average directional movement Index- Neutral. All indicators confirm a mixed trend.
It is good to sell on rallies around 198.48-50 with SL around 199 for TP of 197.


