


 FxWirePro: AUD/USD edges lower, but bullish outlook persists
  FxWirePro- Major Pair levels and bias summary
  FxWirePro: USD/ZAR advances as South African rand weakens amid renewed Middle East tensions
  FxWirePro- Woodies pivot (Major)
  FxWirePro:EUR/NZD dips below lower range, bearish bias increases
  FxWirePro- Woodies pivot (Major)
  JPY Action Bias: Extremely Bullish Surge Ignites Across NZD, GBP & AUD
  FxWirePro: USD/CAD falls after BoC rate hold and weak U.S. producer inflation
  FxWirePro: GBP/USD under pressure despite UK's modest economic growth
  GBPUSD, AUDUSD & NZDUSD Turn Extremely Bullish: Strong Positive Momentum Drives Major Pair Action Bias
  Crypto Major Pair Action Bias: ETHUSD Bullish as BTCUSD, SOLUSD & XRPUSD Stay Neutral
  Gold Loses Steam After Strong U.S. Retail Sales
  FxWirePro: EUR/AUD outlook weaker on renewed downside pressure
  AUDJPY Bullish Surge: Strong Australian Dollar Fuels Fresh Upside as Pair Holds Above 113.50 and All EMAs Align


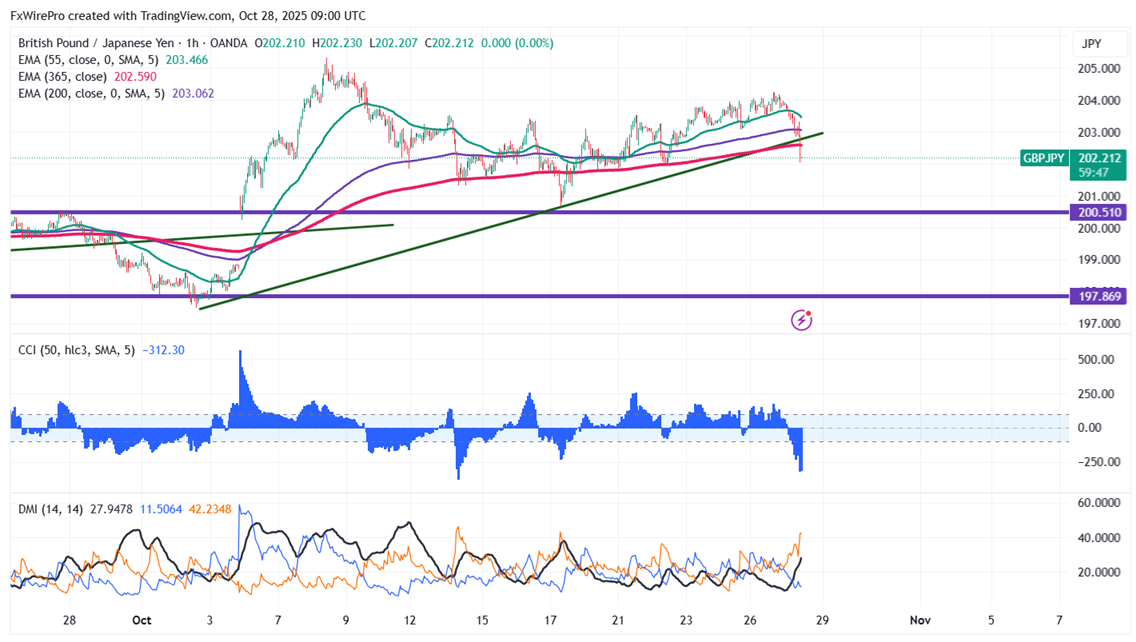
GBPJPY broke significant trend line support after a long consolidation. Intraday trend remains bearish as long as the resistance at 202.60 holds. Trading around 203.49 right now, the pair reached an intraday high of 203.
Oscillators and moving averages to forecast the trend of GBPJPY
CMP- 202.192
EMA (1-hour chart)
55-EMA- 203.56
200-EMA- 203.07
365-EMA- 202.59. The pair trades below short and above long term moving average.
Major Support- 202. Any breach below will drag the pair down 201.30/200.68/ 200/199.30/198.34/197.40.
Major resistance - 202.60. Any break above confirms minor bullishness; a jump to 203/203.40/204/204.25/205 is possible.
Indicator (1-hour chart)
CCI (50)- Bearish
Average directional movement Index- Bearish. All indicators confirm a weak trend.
It is good to sell on rallies around 202.38-40 with SL around 203 for TP of 200.80/200.


