


 FxWirePro:GBP/USD recovers slightly from early decline but bears are not done yet
  FxWirePro- Major Crypto levels and bias summary
  FxWirePro- Major Pair levels and bias summary
  AUDJPY Bears Take a Breather at 111.50, But ‘Sell on Rallies’ Still Eyes 110
  FxWirePro: GBP/AUD sustains gains as uptrend remains strong
  EURJPY Bounce Loses Steam Below 184 — Sell-the-Rally Setup Eyes 183 Target
  Bitcoin Sheds $491M in ETF Outflows and Retreats Below $64K; Sellers Reload for $50K
  FxWirePro: USD/ZAR slips as dollar weakens after PCE inflation data
  AUDJPY Breaks Key Trendline Support — Bears Eye 110 as Momentum Accelerates
  FxWirePro- Major Crypto levels and bias summary
  FxWirePro: EUR/AUD bullish outlook with scope to target 1.6550
  FxWirePro: GBP/AUD edges higher but bullish outlook persists
  FxWirePro: USD/CAD uptrend loses steam, remains on bullish path
  ETH Bounces as Shorts Cover, Yet ETF Bleed Warns $1,850 Resistance Won’t Break
  FxWirePro: AUD/USD drifts lower, uninspired by jobs beat
  FxWirePro:NZD/USD rout continues without relief


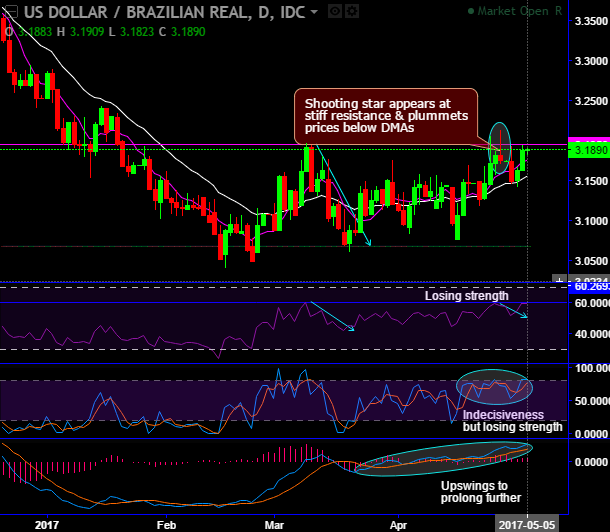
On daily charts, we see stiff resistance at 3.1950 levels where the pair has shown a convincing supply zone in the recent history.
Shooting star has appeared at 3.1761 levels pulling back from highs of 3.2140 after bears surpassing this stiff resistance to plummets prices below 7DMAs. However, this week it has managed to test support at 21EMAs to bounce back again but upswings are restrained at the same resistance levels.
Both leading oscillators (RSI and stochastic curves) have indecisiveness but indicate losing strength in previous rallies, historically it has shown the faded strength at the same levels.
Whereas MACD signals upswings to prolong further if the ongoing rallies manage to break out above mentioned resistance level.
On a broader perspective, we see the major trend has turned into corrective modes for more than one and a half years.
Ever since shooting star has occurred at peaks of uptrend at 4.0093 levels it has tumbled retrace more than 23.6% Fibonacci levels.
Thereafter, when prices slid below EMAs it has managed to retrace below 38.2% Fibonacci levels again. Most importantly, whenever it showed the stern bearish effects to cross the significant Fibonacci levels the bearish candles with big real bodies have popped up that is in conformity to the weakness in the trend.
RSI on this timeframe has evidenced downward convergence that signals no strength in rallies.
While MACD indicates downtrend to prolong further but remains in bullish trajectory.
Overall, current prices are lingering at 38.2% Fibonacci levels which are just 50 pips away from above mentioned stiff resistance levels. Hence, we conclude by saying if bulls manage to break out this pivot levels then the ongoing rallies may like to extend further, otherwise failure swings can resume southward travel upto 2.8891 levels (i.e. next strong supports at 50% Fibonacci level).
Trade tips:
Well, on hedging perspectives, keeping an eye on decisive breach resistance at 3.1950-20 levels and the major trend that is weaker, contemplating above technical reasoning we advocate below option strategy:
Options straddle is the best suitable in such uncertain circumstances with 50% delta.
Long options straddle that likely to fetch unlimited returns during above mentioned higher implied volatility scenarios short term.
Thus, initiate long in 2M at the money -0.49 delta puts, simultaneously go long in 2M at the money +0.51 delta call and limited risk to the extent of initial premiums paid options.


