


 FxWirePro: NZD/USD consolidates overnight gains, but loses momentum
  NZDJPY Retreats on Yen Strength – Bearish Setup Targets 90 After Hitting 92.75 Low
  Nikkei Surges Past 65,000 on Suspected Yen Weakness: Tech Giants Like Advantest and NEC Lead Explosive Gains
  US Magnificent 7 Stocks Trend Score: Amazon & Microsoft Hit Extreme Bullish (+100) as Meta Drops to -100 — Key Resistance & Support Watchlist
  FxWirePro: USD/JPY dips as market assess risk of additional FX intervention.
  FxWirePro- Major Crypto levels and bias summary
  FxWirePro: USD/CAD retreats after Canada posts stronger-than-expected GDP growth
  US Magnificent 7 Stocks Trend Score: Amazon & Microsoft Hit Extreme Bullish (+100) as Meta Drops to -100 — Key Resistance & Support Watchlist
  FxWirePro: EUR/ AUD dips below 1.6400 level, focus on near term support
  FxWirePro: GBP/USD rises as soft US data pressures dollar
  FxWirePro: GBP/AUD bears maintain upper hand
  FxWirePro:USD/JPY climbs back above 160.00 after BOJ rate decision
  FxWirePro: USD/ZAR gains as stronger dollar outweighs upbeat South Africa's trade surplus
  Major European Indices Score Extremely Bullish: DAX Eyes 26000, CAC Targets 8600, FTSE100 at 11000 – Key Levels to Watch
  FxWirePro: GBP/AUD drifts lower after BOE rate decision
  Major FX Action Bias & US Market Sentiment: NZD/USD (Extremely Bullish) & AUD/USD (Bullish) Watchlist


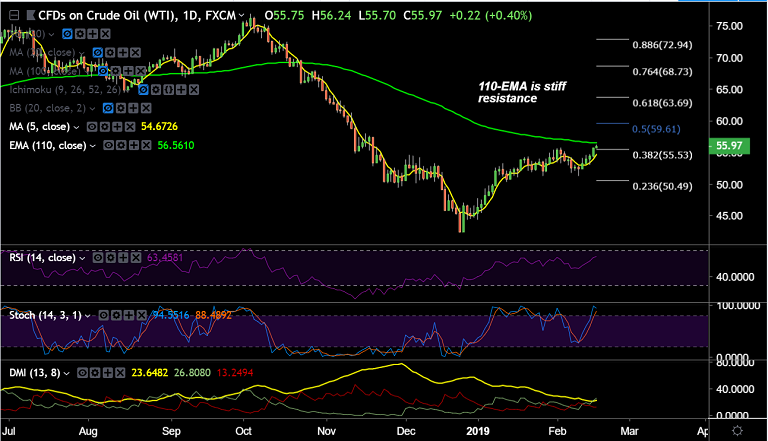
US oil chart on Trading View used for analysis
- WTI edges lower from fresh 3-month highs at 56.24, intraday bias higher.
- US-China trade progress, DXY softness, Venezuela sanctions and OPEC output cuts support prices.
- Price action is extending gains above daily cloud. Upside pauses shy of 110-EMA at 56.56.
- Break above 56.56 to see further upside. Scope then for test 50% Fib at 59.61.
- 5-DMA is immediate support at 54.68. Break below will see weakness till 53.54 (21-EMA).
Support levels - 54.69 (5-DMA), 53.54 (21-EMA), 50.49 (23.6% Fib)
Resistance levels - 56.56 (110-EMA), 57 (100-DMA), 57.93 (Nov 16 high)
For details on FxWirePro's Currency Strength Index, visit http://www.fxwirepro.com/currencyindex.


