


 FxWirePro: EUR/ AUD dips below 1.6400 level, focus on near term support
  FxWirePro- Major Crypto levels and bias summary
  AUD/JPY Slips Below 112 as BOJ Intervention Sparks Bearish Momentum: Sell the Rallies
  FxWirePro- Major Crypto levels and bias summary
  FxWirePro: NZD/USD consolidates overnight gains, but loses momentum
  US Magnificent 7 Stocks Trend Score: Amazon & Microsoft Hit Extreme Bullish (+100) as Meta Drops to -100 — Key Resistance & Support Watchlist
  FxWirePro: GBP/NZD remains weak, eyes 38.2%fib support
  Major FX Action Bias & US Market Sentiment: NZD/USD (Extremely Bullish) & AUD/USD (Bullish) Watchlist
  FxWirePro- Major Pair levels and bias summary
  FxWirePro: AUD/USD gains some ground but outlook is bearish
  Major European Indices Score Extremely Bullish: DAX Eyes 26000, CAC Targets 8600, FTSE100 at 11000 – Key Levels to Watch
  NZDJPY Retreats on Yen Strength – Bearish Setup Targets 90 After Hitting 92.75 Low
  NZDJPY Bullish Rebound: Buy Dips as EMAs Align for 97 Target
  FxWirePro: GBP/AUD drifts lower after BOE rate decision
  FxWirePro: GBP/USD rises as soft US data pressures dollar
  FxWirePro: GBP/AUD bears maintain upper hand


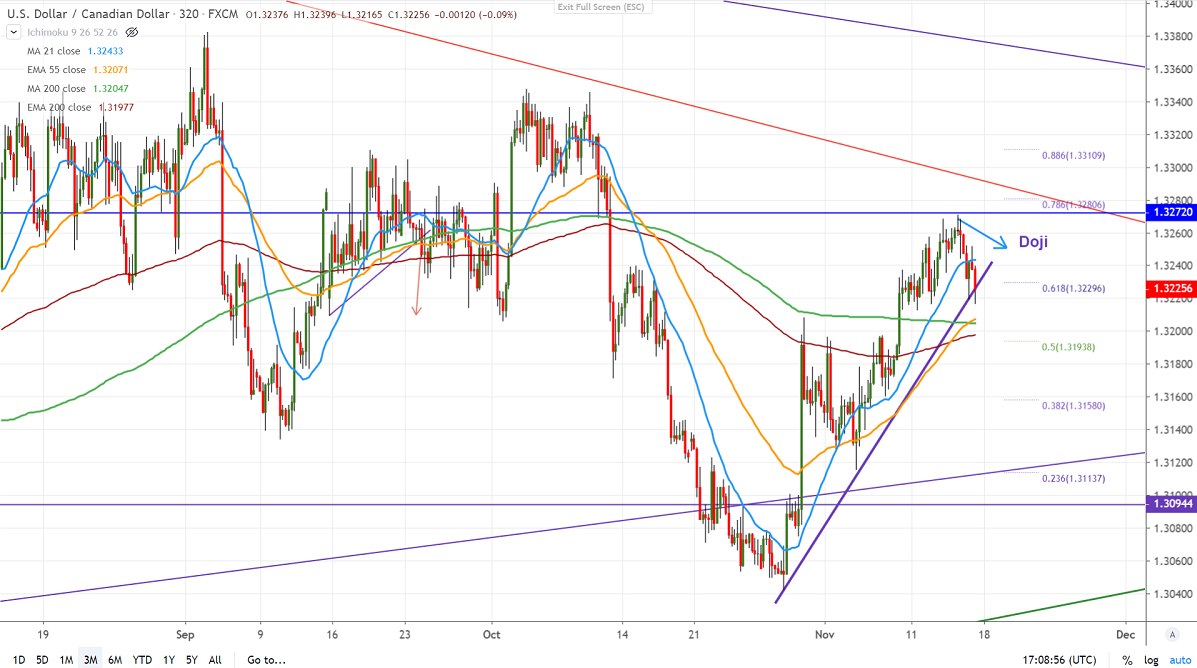
Candlestick pattern - Doji (8-hour chart)
Major trend line support- 1.32150
USDCAD is on the upside after forming bottom around 1.30421 on Oct 29th, 2019. It hits high of 1.32706 and shown a minor decline till trend line support. It is currently trading around 1.32295. The Canadian dollar was one the worst performer this month as BOC hinted chance of rate cut on trade uncertainty.
US retail sales rebounded in Oct by 0.3%, which is lifted mainly by motor vehicle purchases and higher gasoline prices. It came much better than -0.3% in Sep, slightly above the forecast at 0.2%.
Technically, the pair is facing strong resistance around 1.3275 (200- day MA), any indicative break above will take the USDCAD to next level till 1.3300/1.3385. Major bullish continuation only if it goes beyond 1.3385.
On the flip side, trend line 1.3215 is acting as near term support, close below that level targets 1.318/1.3135/1.3100.
It is good to buy on dips around 1.3218-20 with SL around 1.3180 for the TP of 1.3300.


