


 FxWirePro: AUD/USD dips after RBA Governor speech
  Major Pairs Action Bias: USDCAD and USDCHF Stand Out as Extremely Bullish While GBPUSD and NZDUSD Turn Extremely Bearish
  FxWirePro: USD/CAD runs out of steam but maintains bullish outlook
  FxWirePro: GBP/AUD gains some upside momentum but still bearish
  FxWirePro: NZD/USD edges lower, remains on back foot
  FxWirePro: EUR/AUD outlook weaker on renewed downside pressure
  JPY Pairs Action Bias: EURJPY Leads as Bullish Standout Amid Mixed Momentum
  FxWirePro: GBP/NZD maintains bersish bias with focus on 2.2900 level
  FxWirePro : USD/JPY holds relatively bid on 163 ahead Of FOMC,BoJ meetings
  NZDJPY Pullback: Sell Rallies Toward 93.30 as Yen Weakness Eases
  FxWirePro: GBP/AUD downside pressure builds, key support level in focus
  FxWirePro: GBP/USD edges higher as traders await BoE guidance and UK fiscal clarity
  Crypto Action Bias: ETHUSD Stands Out as the Bullish Pair to Watch
  EUR/JPY Holds Bullish Bias as Euro Extends Recovery
  EUR/USD Bounces from Monthly Low, But Bearish Pressure Remains
  Major Forex Pairs Action Bias: GBPUSD and AUDUSD Turn Extremely Bearish


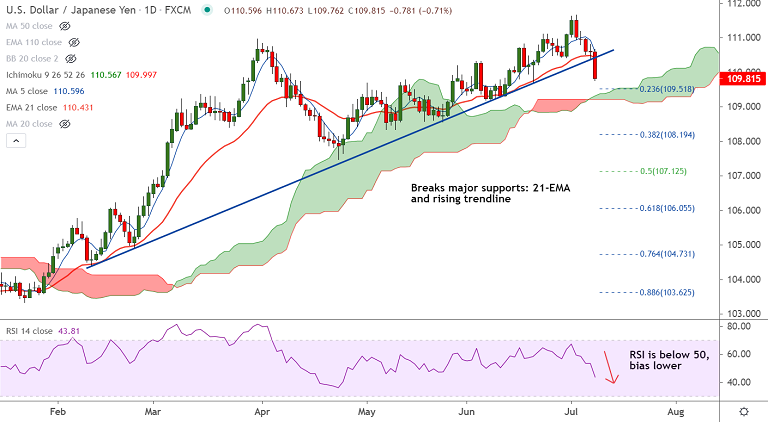
USD/JPY chart - Trading View
USD/JPY was trading 0.73% lower on the day at 109.79 at around 08:00 GMT, slightly above session lows at 109.76.
The pair came under some heavy selling pressure on Thursday, dived over 0.75% to hit 2-week lows.
COVID-19 jitters amid rising cases of the Delta variant and the resulting risk-off mood benefitted the safe-haven JPY and contributed to the selling bias.
Souring market sentiment saw a rally in US bonds, pushing US 10-year yields to break below the key 1.30% level.
Price action has slipped below 21-EMA and is currently testing support at 55-EMA at 109.76.
Momentum studies are strongly bearish. MACD shows bearish crossover on signal line. The pair has broken major trendline support.
Major Support Levels:
S1: 109.51 (23.6% Fib)
S2: 109.22 (cloud base)
S3: 108.89 (200-week MA)
Major Resistance Levels:
R1: 110.43 (21-EMA)
R2: 110.60 (5-DMA)
R3: 110.85 (200H MA)
Summary: USD/JPY bears eye 23.6% Fib at 109.51. Cloud offers strong support, breach below will open downside.


