


 BTC Slips Below $60K as Institutional Demand Dries Up — Bears Eye $59K Support, Rallies to $63K for Shorts
  Wall Street Analysts Weigh in on Latest NFP Data
  Moody's Upgrades Argentina's Credit Rating Amid Economic Reforms
  China’s Growth Faces Structural Challenges Amid Doubts Over Data
  2025 Market Outlook: Key January Events to Watch
  FxWirePro: GBP/AUD sustains gains as uptrend remains strong
  NZDJPY Bears Reload as 92 Resistance Caps Bounce; Sell-on-Rallies Eyed Toward 90
  FxWirePro: EUR/AUD bullish outlook with scope to target 1.6500
  UBS Predicts Potential Fed Rate Cut Amid Strong US Economic Data
  NZDJPY: The Kiwi Yen's Bull Run Hits a Brick Wall at 92 — Sell the Rally?
  AUDJPY Breaks Key Trendline Support — Bears Eye 110 as Momentum Accelerates
  FxWirePro: GBP/USD heads deeper into bear territory, 23.6% fibonacci eyed
  Goldman Predicts 50% Odds of 10% U.S. Tariff on Copper by Q1 Close
  FxWirePro:NZD/USD rout continues without relief
  FxWirePro- Major Pair levels and bias summary
  AUDJPY Bears Take a Breather at 111.50, But ‘Sell on Rallies’ Still Eyes 110
  FxWirePro- Major Crypto levels and bias summary


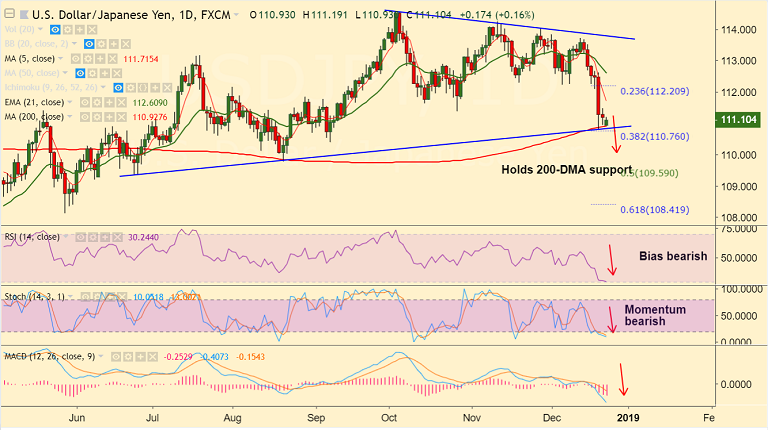
USD/JPY chart on Trading View used for analysis
- USD/JPY is showing a sluggish recovery in the Asian trade today, trades 0.09% higher on the day at 111.10 at the time of writing.
- The major has found major support at 200-DMA and we see weakness only on break below.
- Momentum indicators are strongly bearish and we do not see major signs of reversal.
- Stochs are at oversold territory and price action has been raging outside the Lower BB. We could see minor bounce at current levels.
- That said, a far less hawkish Fed and a flight to safety as global stocks extend downside will continue to support downside.
- Decisive break below 200-DMA will see next major support at 110.30 (Lower BB) and the 109.59 (50% Fib).
- Bounce off 200-DMA could see upside till 21-EMA at 112.60. Bearish invalidation likely above 113.80 (Triangle top).
Support levels - 110.92 (200-DMA), 110.30 (Lower BB), 109.59 (50% Fib)
Resistance levels - 111.71 (5-DMA), 112, 112.20 (23.6% Fib)
For details on FxWirePro's Currency Strength Index, visit http://www.fxwirepro.com/currencyindex.


