


 FxWirePro- Major Crypto levels and bias summary
  Global Markets React to Strong U.S. Jobs Data and Rising Yields
  Stock Futures Dip as Investors Await Key Payrolls Data
  FxWirePro: GBP/NZD gaining momentum for a move towards 2.3100 level
  NZDJPY: The Kiwi Yen's Bull Run Hits a Brick Wall at 92 — Sell the Rally?
  Fed May Resume Rate Hikes: BofA Analysts Outline Key Scenarios
  FxWirePro:NZD/USD rout continues without relief
  FxWirePro: GBP/AUD sustains gains as uptrend remains strong
  U.S. Banks Report Strong Q4 Profits Amid Investment Banking Surge
  2025 Market Outlook: Key January Events to Watch
  European Stocks Rally on Chinese Growth and Mining Merger Speculation
  Urban studies: Doing research when every city is different
  FxWirePro: USD/JPY edges higher as the yen remains vulnerable despite repeated warnings of intervention.
  FxWirePro: GBP/USD heads deeper into bear territory, 23.6% fibonacci eyed
  China’s Growth Faces Structural Challenges Amid Doubts Over Data
  Lithium Market Poised for Recovery Amid Supply Cuts and Rising Demand
  Moldova Criticizes Russia Amid Transdniestria Energy Crisis


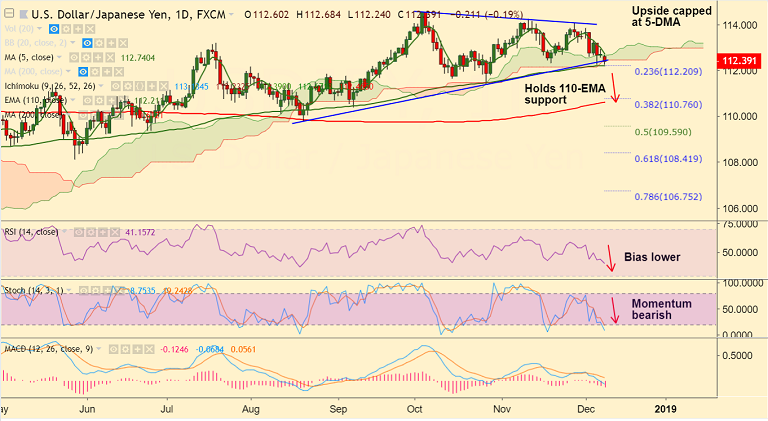
USD/JPY chart on Trading View used for analysis
- USD/JPY has started the week on a backfoot, trades 0.26% lower on the day at 112.39 at the time of writing.
- The pair is extending weakness on the back of an unimpressive monthly employment report on Friday.
- Data showed that U.S. employers hired 155K workers in November, fewer than forecast, although the unemployment rate remained steady at 3.7% (at near a 49-year low).
- The poor result raises concerns that U.S. growth is moderating and the Federal Reserve may stop raising rates sooner than previously thought.
- On the data front for the week we have:
- Producer Price Index (PPI) for the month of November (Tuesday)
- Consumer Price Index (CPI) for the month of November (Wednesday)
- Core Retail Sales, Industrial Production, and Purchasing Managers' Index (PMI) all for the month of November (Friday)
- Also, the IMF Chief Economist Maurice Obstfeld said in an interview on Sunday, the US economic growth is likely to slowdown in the coming years.
- March 1st 'hard deadline' for China trade deal set by the U.S. could make investors even more nervous than they already are.
- Technical bias is also bearish. Price has dipped below cloud and is on track for further downside.
- The Pair finds strong support at 112.20 (nearly converged 110-EMA and 23.6% Fib). Break below to see further weakness.
- On the flipside, 5-DMA is immediate resistance is seen at 5-DMA at 112.75. Break above to see minor upside.
Support levels - 112.20 (nearly converged 110-EMA and 23.6% Fib), 111.62 (Oct 15 low)
Resistance levels - 112.75 (5-DMA), 113.08 (21-EMA)
For details on FxWirePro's Currency Strength Index, visit http://www.fxwirepro.com/currencyindex.


