


 FxWirePro: NZD/USD consolidates overnight gains, but loses momentum
  FxWirePro- Major Crypto levels and bias summary
  FxWirePro- Major Pair levels and bias summary
  FxWirePro: AUD/USD gains some ground but outlook is bearish
  FxWirePro:USD/JPY climbs back above 160.00 after BOJ rate decision
  FxWirePro: GBP/AUD drifts lower after BOE rate decision
  US Magnificent 7 Stocks Trend Score: Amazon & Microsoft Hit Extreme Bullish (+100) as Meta Drops to -100 — Key Resistance & Support Watchlist
  FxWirePro: GBP/AUD bears maintain upper hand
  FxWirePro: GBP/NZD remains weak, eyes 38.2%fib support
  FxWirePro: GBP/USD rises as soft US data pressures dollar
  JPY Currency Meter Signals: NZDJPY Bullish (+25) vs CHFJPY (-100) – These Pairs Could Move Next
  Nikkei Surges Past 65,000 on Suspected Yen Weakness: Tech Giants Like Advantest and NEC Lead Explosive Gains
  AUDJPY Volatile After Massive Sell-Off: Sell Rallies at 113, Targeting 110 as Bearish Momentum Surges
  FxWirePro: GBP/NZD remains weak, eyes 38.2%fib support
  Major European Indices Score Extremely Bullish: DAX Eyes 26000, CAC Targets 8600, FTSE100 at 11000 – Key Levels to Watch
  FxWirePro: USD/CNY dips to hit three year low,scope for further downside


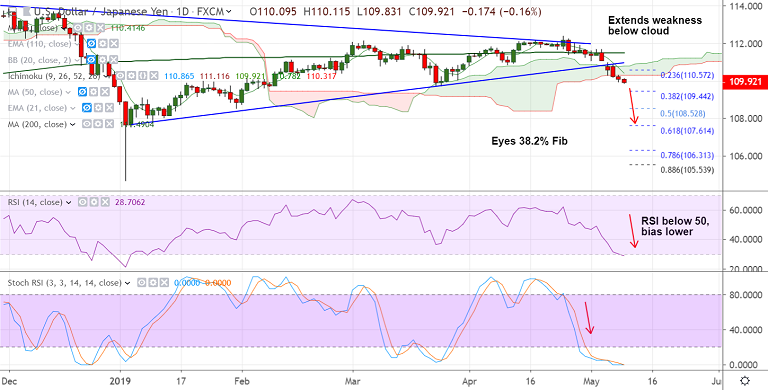
USD/JPY chart - Trading View
- USD/JPY is extending weakness below daily cloud, trades 0.16% lower at 109.92 at 0345 GMT.
- The pair has broken major supports - 110.80 (trendline) and 110.31 (cloud base) opening up further downside.
- Price action has slipped below major EMAs and technical indicators are highly bearish.
- Volatility rising on the daily charts and momentum with the bears. MACD and DMI support downside.
- Break below daily cloud has raised scope for weakness till 109.44 (38.2% Fib). Bearish invalidation above 200-DMA.
- Risk-sentiment is likely to remain as the sole driver for price action until U.S. inflation data on Friday.
Support levels - 109.44 (38.2% Fib), 109, 108.52 (converged 50% Fib and Jan 31st low)
Resistance levels - 110.31 (cloud base), 110.41 (5-DMA), 111
Call update: Our previous call (https://www.econotimes.com/FxWirePro-USD-JPY-breaks-below-daily-cloud-eyes-382-Fib-at-10944-1533882) is progressing well.
Recommendation: Stay short for targets.
For details on FxWirePro's Currency Strength Index, visit http://www.fxwirepro.com/currencyindex.


