


 FxWirePro- Major Pair levels and bias summary
  Global Markets React to Strong U.S. Jobs Data and Rising Yields
  2025 Market Outlook: Key January Events to Watch
  FxWirePro- Major Crypto levels and bias summary
  FxWirePro: GBP/NZD gaining momentum for a move towards 2.3350level
  Oil Prices Dip Slightly Amid Focus on Russian Sanctions and U.S. Inflation Data
  FxWirePro: AUD/USD eases after Australian mixed CPI data
  NZDJPY: The Kiwi Yen's Bull Run Hits a Brick Wall at 92 — Sell the Rally?
  Gold Prices Fall Amid Rate Jitters; Copper Steady as China Stimulus Eyed
  UBS Predicts Potential Fed Rate Cut Amid Strong US Economic Data
  Bitcoin Sheds $491M in ETF Outflows and Retreats Below $64K; Sellers Reload for $50K
  FxWirePro: USD/CNY hits one –month high, scope for further upside
  U.S. Treasury Yields Expected to Decline Amid Cooling Economic Pressures
  FxWirePro: NZD/USD downside pressure builds, key support level in focus
  Trump’s "Shock and Awe" Agenda: Executive Orders from Day One
  Moody's Upgrades Argentina's Credit Rating Amid Economic Reforms


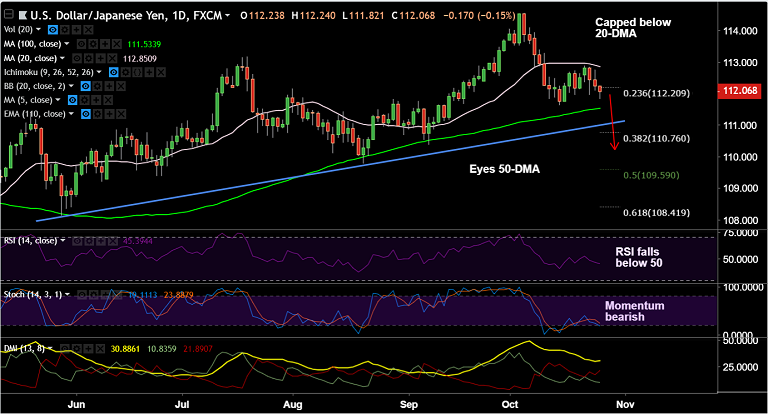
USD/JPY chart on Trading View used for analysis
- USD/JPY trades in the red for the 3rd consecutive session, bias lower.
- S&P 500 futures have dropped well below the key support of the 50-week EMA, emboldening the bears.
- The pair has retraced dip below 112 handle and is currently trading at 112.15 after hitting session lows at 111.82.
- The combination of market risk in equities, political risk in Europe (Brexit and Italy) and economic risk around the globe will keep safe havens in demand.
- Focus now on the forthcoming Bank of Japan (BoJ) policy meeting scheduled for October 31.
- Also, U.S. Q3 GDP data due later this week will be watched for clues on further direction.
- Price has broken below 23.6% Fib. We see scope for test of 50-DMA at 111.53 ahead of daily cloud. Violation at daily cloud will see further bearishness.
- On the upside, 20-DMA is major resistance. We see bearish invalidation on break above.
Support levels - 112 (major trendline support), 111.53 (50-DMA)
Resistance levels - 112.20 (23.6% Fib), 112.85 (20-DMA), 113.17 (July 19 high)
Recommendation: Good to stay short on upticks, SL: 112.90, TP: 111.55/ 111
For details on FxWirePro's Currency Strength Index, visit http://www.fxwirepro.com/currencyindex.


