


 FxWirePro: USD/CAD retreats after Canada posts stronger-than-expected GDP growth
  FxWirePro: USD/ZAR gains as stronger dollar outweighs upbeat South Africa's trade surplus
  Nikkei Surges Past 65,000 on Suspected Yen Weakness: Tech Giants Like Advantest and NEC Lead Explosive Gains
  FxWirePro: GBP/AUD drifts lower after BOE rate decision
  FxWirePro: AUD/USD gains some ground but outlook is bearish
  JPY Currency Meter Signals: NZDJPY Bullish (+25) vs CHFJPY (-100) – These Pairs Could Move Next
  AUD/JPY Slips Below 112 as BOJ Intervention Sparks Bearish Momentum: Sell the Rallies
  FxWirePro: GBP/AUD bears maintain upper hand
  NZDJPY Bullish Rebound: Buy Dips as EMAs Align for 97 Target
  Major European Indices Score Extremely Bullish: DAX Eyes 26000, CAC Targets 8600, FTSE100 at 11000 – Key Levels to Watch
  FxWirePro: GBP/NZD remains weak, eyes 38.2%fib support
  US Magnificent 7 Stocks Trend Score: Amazon & Microsoft Hit Extreme Bullish (+100) as Meta Drops to -100 — Key Resistance & Support Watchlist
  FxWirePro- Major Pair levels and bias summary
  FxWirePro: GBP/USD rises as soft US data pressures dollar
  FxWirePro- Woodies pivot (Major)
  Major FX Action Bias & US Market Sentiment: NZD/USD (Extremely Bullish) & AUD/USD (Bullish) Watchlist


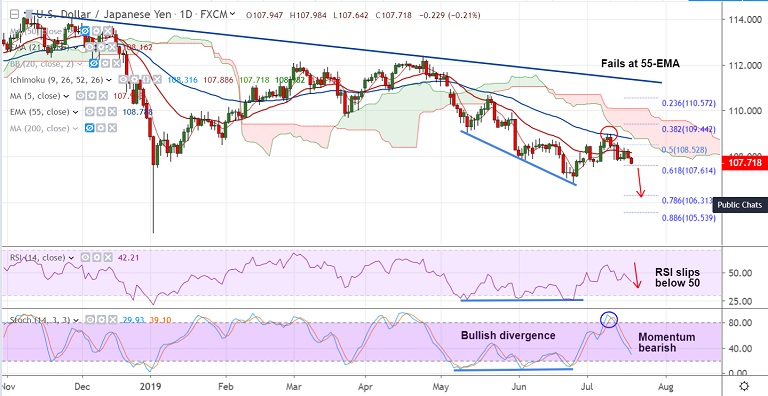
USD/JPY chart - Trading View
USD/JPY recovery has been capped at 21-EMA resistance. The pair is extending lower for the second straight session.
MACD is on verge of bearish crossover on signal line, negative DMI crossover on positive DMI seen.
Major trend is bearish and upside has seen rejection at 55-EMA. Stochs and RSI are sharply lower and RSI is well below 50 levels.
Price action currently hovers around 61.8% Fib. Break below will see test of lower Bollinger band at 107.08.
Immediate resistance is seen at 20-DMA at 107.99. Retrace above could see minor upside.
Support levels - 107.61 (61.8% Fib), 107.08 (Lower BB), 106.78 (June 25 low)
Resistance levels - 107.99 (20-DMA), 108.52 (50% Fib), 108.78 (55-EMA)
For details on FxWirePro's Currency Strength Index, visit http://www.fxwirepro.com/currencyindex.


