


 NZD/JPY Flatlines Near 94.60: Will Key Support Reignite the Uptrend?
  FxWirePro: EUR/AUD regains upwards momentum but unable to hold above 50%fib level
  FxWirePro: USD/CAD slips after Fed holds rates steady
  FxWirePro: USD/JPY edges higher as focus shifts to BOJ decision
  EURUSD Spikes to 1.14306 on Fed Pause as Traders Eye Sell-the-Rally Setup
  FxWirePro: GBP/AUD gains above 1.9200 level , upside pressure builds
  FxWirePro- Woodies pivot (Major)
  FxWirePro: GBP/USD edges lower ahead of Fed policy verdict
  AUD/JPY Slips Below 112 as BOJ Intervention Sparks Bearish Momentum: Sell the Rallies
  NZDJPY Bullish Rebound: Buy Dips as EMAs Align for 97 Target
  FxWirePro- Major Crypto levels and bias summary
  FxWirePro: USD/ CNY hits one-month low,scope for futher downside
  FxWirePro: AUD/USD dips below lower range, bearish bias increases
  FxWirePro: GBP/AUD drifts lower after BOE rate decision
  Major Forex Pairs Action Bias: GBPUSD and AUDUSD Turn Extremely Bearish
  FxWirePro: GBP/USD rises as soft US data pressures dollar


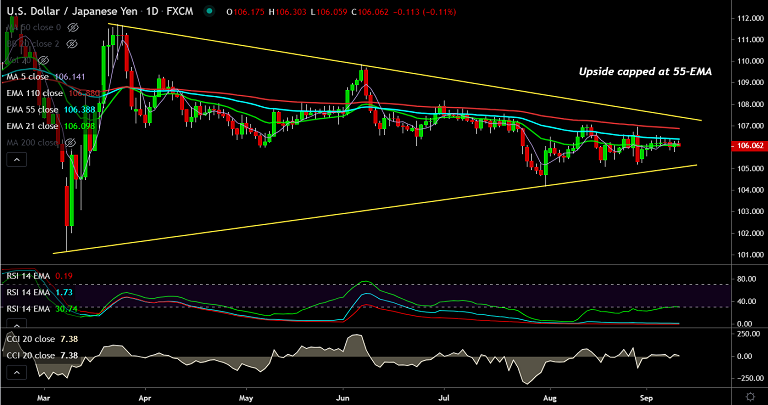
USD/JPY chart - Trading View
USD/JPY is extending sideways movement as price action remains capped below 55-EMA.
Technical indicators do not provide a clear directional bias. RSI and Stochastics have gone flat on the daily charts.
Major trend on the weekly charts is bearish and bias tilted lower as long as pair remains capped below 55-EMA.
Break above 55-EMA will see test of 38.2% Fib at 107.06. 200-DMA is major resistance at 107.83.
On the flipside, retrace below cloud will see bearish continuation. Dip till 104 levels likely.







