


 FxWirePro: GBP/NZD remains weak, eyes 38.2%fib support
  AUDJPY Volatile After Massive Sell-Off: Sell Rallies at 113, Targeting 110 as Bearish Momentum Surges
  FxWirePro- Major Pair levels and bias summary
  NZDJPY Retreats on Yen Strength – Bearish Setup Targets 90 After Hitting 92.75 Low
  Major FX Action Bias & US Market Sentiment: NZD/USD (Extremely Bullish) & AUD/USD (Bullish) Watchlist
  FxWirePro: NZD/USD consolidates overnight gains, but loses momentum
  FxWirePro- Major Crypto levels and bias summary
  US Magnificent 7 Stocks Trend Score: Amazon & Microsoft Hit Extreme Bullish (+100) as Meta Drops to -100 — Key Resistance & Support Watchlist
  JPY Currency Meter Signals: NZDJPY Bullish (+25) vs CHFJPY (-100) – These Pairs Could Move Next
  Major European Indices Score Extremely Bullish: DAX Eyes 26000, CAC Targets 8600, FTSE100 at 11000 – Key Levels to Watch
  NZDJPY Bullish Rebound: Buy Dips as EMAs Align for 97 Target
  FxWirePro: AUD/USD gains some ground but outlook is bearish
  US Magnificent 7 Stocks Trend Score: Amazon & Microsoft Hit Extreme Bullish (+100) as Meta Drops to -100 — Key Resistance & Support Watchlist
  FxWirePro: USD/CNY dips to hit three year low,scope for further downside
  FxWirePro: USD/CAD retreats after Canada posts stronger-than-expected GDP growth
  AUD/JPY Slips Below 112 as BOJ Intervention Sparks Bearish Momentum: Sell the Rallies


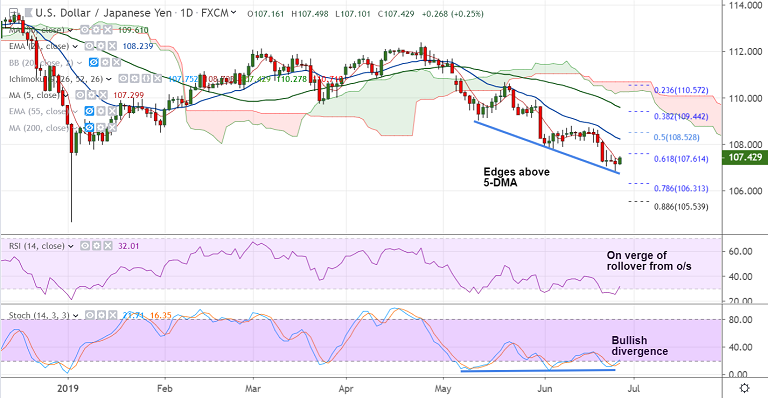
USD/JPY chart - Trading View
USD/JPY ignores negative Asian equities, trades 0.25% higher on the day at 107.43 at 04:10 GMT.
Less dovish rhetoric from Fed speakers overnight helps US dollar recovery, pushing the pair higher.
Technical indicators show signs of further upside in the major. 'Bullish Divergence' on Stochastics supports upside.
The pair has bounced off with a 'Hammer' formation and edged above 5-DMA. Stochs and RSI are on verge of a bullish rollover from oversold levels.
Major trend in the pair is bearish. Price action is currently capped at stiff resistance at 110H EMA at 107.46. Break above will see further gains.
Next major hurdle on the upside lies at 200H SMA at 107.87 ahead of 108.23 (21-EMA).
Rejection at 110H EMA and resumption of downside eyes 78.6% Fib at 106.31. Bearish invalidation only above 200-DMA.
Support levels - 106.31 (78.6% Fib), 106, 105.53 (88.6% Fib)
Resistance levels - 107.87 (200H SMA), 108, 108.23 (21-EMA)
Recommendation: Stay long above 110H EMA (107.46), SL: 107.00, TP: 107.85/ 108.25/ 108.50
Refer our previous call (https://www.econotimes.com/FxWirePro-USD-JPY-holds-above-107-handle-eyes-786-Fib-at-10631-1552837).
For details on FxWirePro's Currency Strength Index, visit http://www.fxwirepro.com/currencyindex.


