


 FxWirePro- Major Crypto levels and bias summary
  Nikkei Surges Past 65,000 on Suspected Yen Weakness: Tech Giants Like Advantest and NEC Lead Explosive Gains
  FxWirePro: USD/CAD retreats after Canada posts stronger-than-expected GDP growth
  FxWirePro- Woodies pivot (Major)
  FxWirePro: USD/JPY dips as market assess risk of additional FX intervention.
  FxWirePro: USD/ZAR gains as stronger dollar outweighs upbeat South Africa's trade surplus
  FxWirePro- Major Pair levels and bias summary
  FxWirePro: EUR/ AUD dips below 1.6400 level, focus on near term support
  Major European Indices Score Extremely Bullish: DAX Eyes 26000, CAC Targets 8600, FTSE100 at 11000 – Key Levels to Watch
  FxWirePro: AUD/USD gains some ground but outlook is bearish
  FxWirePro: USD/CNY dips to hit three year low,scope for further downside
  FxWirePro- Major Pair levels and bias summary
  FxWirePro: NZD/USD consolidates overnight gains, but loses momentum
  FxWirePro: GBP/USD rises as soft US data pressures dollar
  AUDJPY Volatile After Massive Sell-Off: Sell Rallies at 113, Targeting 110 as Bearish Momentum Surges
  NZDJPY Retreats on Yen Strength – Bearish Setup Targets 90 After Hitting 92.75 Low
  FxWirePro: GBP/AUD drifts lower after BOE rate decision


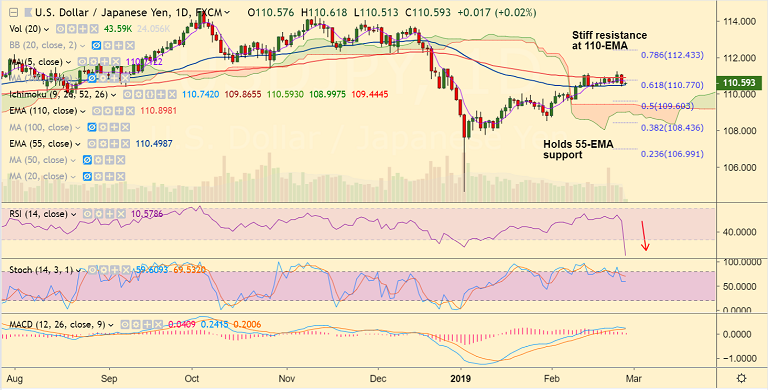
USD/JPY chart on Trading View used for analysis
- USD/JPY has been trading in an extremely narrow range with session high at 110.99 and low at 110.81.
- The major hovers around 110-EMA and decisive break above 111 handle required for further upside.
- Technical studies are biased higher. RSI is above 50 and momentum with the bulls.
- Economic data from Japan earlier today showed construction orders up 19.8 percent y/y in Jan, while housing starts up 1.1 percent y/y.
- USD/JPY is extending downside as the Japanese yen also remains supported by escalating Indo-Pak political tensions.
- We see strong support at 55-EMA at 110.52. Break below will see further downside.
- Focus on U.S. weekly jobless claims report (13:30 GMT), along with Q4 GDP report and Kansas Fed manufacturing activity report (16:00 GMT) for further direction.
Support levels - 110.81 (5-DMA), 110.52 (55-EMA), 110.43 (21-EMA)
Resistance levels - 111, 111.31 (200-DMA), 111.82 (Aug 29, 2018 high)
For details on FxWirePro's Currency Strength Index, visit http://www.fxwirepro.com/currencyindex.


