


 AUDJPY Action Bias: Bullish Dip-Buy Setup Despite Flat Neutral Bias
  FxWirePro: GBP/USD edges higher as traders await BoE guidance and UK fiscal clarity
  AUDJPY Weakness Deepens: Sell Rallies Toward 112 as Aussie Dollar Falters
  FxWirePro: USD/ZAR retreats but trend is still bullish
  FxWirePro: EUR/AUD outlook weaker on renewed downside pressure
  JPY Action Bias: USDJPY Emerges as the Clear Bullish Pair to Watch Amid Mixed Crosses
  FxWirePro- Major Crypto levels and bias summary
  NZDJPY Action Bias: Bullish Dip-Buying Opportunity on Broad Yen Weakness
  FxWirePro- Major Pair levels and bias summary
  EUR/USD Bounces from Monthly Low, But Bearish Pressure Remains
  EUR/JPY Holds Bullish Bias as Euro Extends Recovery
  FxWirePro: USD/CAD gaining momentum for a move towards 1.4200 level
  FxWirePro: AUD/USD dips after RBA Governor speech
  Major Pair Action Bias: Bullish Pairs to Watch Out For
  FxWirePro: NZD/USD edges lower, remains on back foot
  Crypto Action Bias: ETHUSD Stands Out as the Bullish Pair to Watch


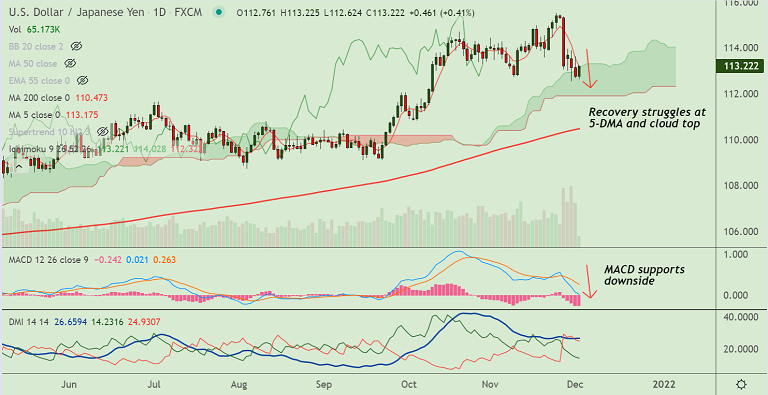
Chart - Courtesy Trading View
Technical Analysis:
GMMA Indicator
- Daily chart: Major trend is neutral, minor trend has turned bearish
- Hourly chart: Major trend is neutral, minor trend has turned bullish
Ichimoku Analysis
- Price closed inside the daily cloud on the daily charts
- Recovery attempts are struggling at 5-DMA and cloud top
Oscillators
- Stochs and RSI are biased lower, RSI is well below 50 mark
- Momentum is strongly bearish
Bollinger Bands
- Bollinger bands are spread wide apart, gap is increasing
- Volatility is high and rising
Major Support Level: 113.05 (55-EMA)
Major Resistance Level: 113.81 (21-EMA)
Summary: USD/JPY trades with a bearish bias. Price action is extending choppy trade around 55-EMA. Bearish invalidation only above 21-EMA.







