


 FxWirePro- Woodies pivot (Major)
  FxWirePro- Major Crypto levels and bias summary
  FxWirePro: GBP/AUD downside pressure builds, key support level in focus
  FxWirePro : USD/JPY holds relatively bid on 163 ahead Of FOMC,BoJ meetings
  FxWirePro: EUR/AUD outlook weaker on renewed downside pressure
  FxWirePro: USD/ZAR uptrend loses steam, remains on bullish path
  Crypto Action Bias: ETHUSD Stands Out as the Bullish Pair to Watch
  NZDJPY Pullback: Sell Rallies Toward 93.30 as Yen Weakness Eases
  FxWirePro: AUD/USD dips after RBA Governor speech
  FxWirePro- Major Pair levels and bias summary
  FxWirePro: USD/CAD gaining momentum for a move towards 1.4200 level
  AUDJPY Action Bias: Bullish Dip-Buy Setup Despite Flat Neutral Bias
  Major Pairs Action Bias: USDCAD and USDCHF Stand Out as Extremely Bullish While GBPUSD and NZDUSD Turn Extremely Bearish
  FxWirePro: GBP/NZD gains some ground but bias is still bearish
  EUR/JPY Holds Bullish Bias as Euro Extends Recovery


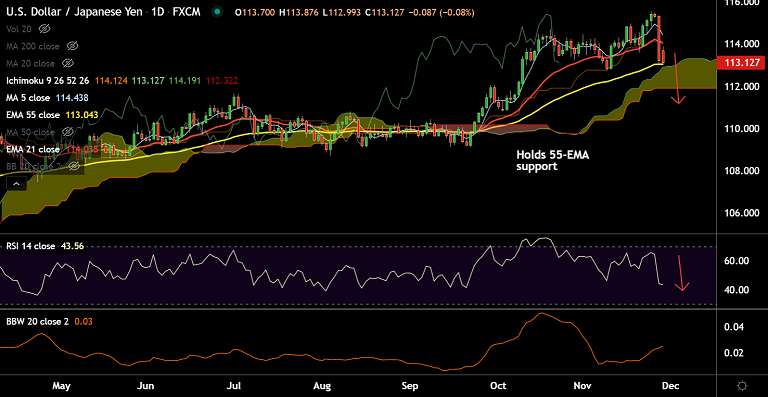
Chart - Courtesy Trading View
Technical Analysis:
GMMA Indicator
- Near and long term moving averages biased strongly bearish on the hourly charts
- Near-term moving averages have turned bearish on the daily charts
Ichimoku Analysis
- Price action is above daily cloud
- The pair has bounced cloud top support
Oscillators
- RSI is below 50, biased lower
- Stochs are on verge of bearish rollover from overbought levels
Bollinger Bands
- Wide spread suggesting high and rising volatility
Major Support Levels: 113.05 (55-EMA), 112.88 (Cloud top), 112.69 (Lower BB)
Major Resistance Levels: 114.07 (21-EMA), 114.50 (5-DMA), 115
Summary: USD/JPY is holding support at 55-EMA, break below will drag the pair lower. Technical bias is bearish on the intraday charts.







