


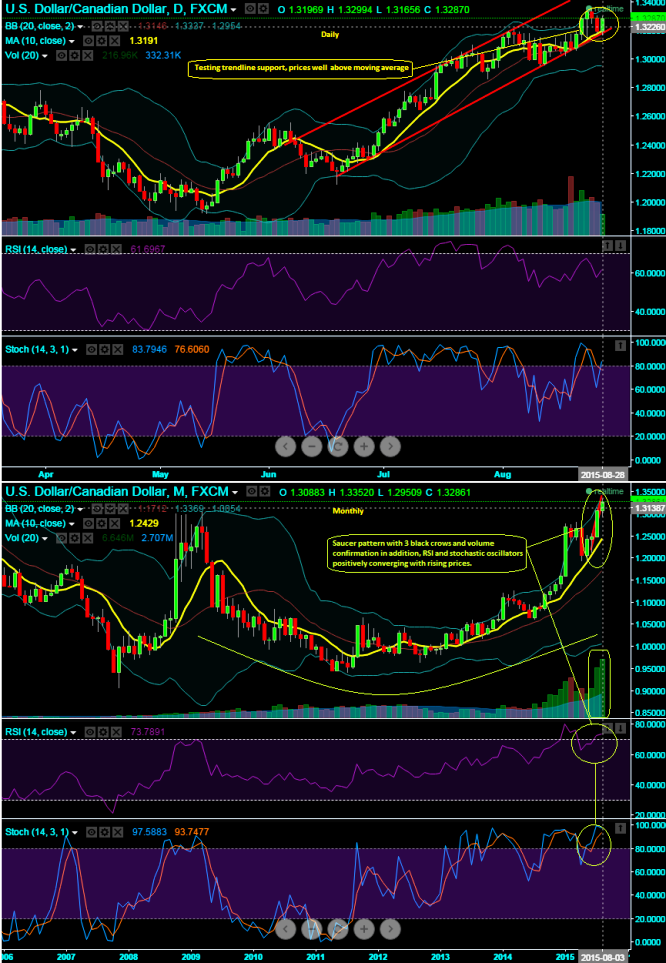
Currently the pair has been able to test trendline support at 1.3288 levels; if we have to compare the same with monthly plotting then we arrive with 3 black crows in a row which signals short term correction which has happened from last 3-4 trading sessions. Long term charts also evidences the saucer pattern on this pair, a rounding bottom of the prolonged downtrend can used to suggest that the long term trend is reversed.
Since this pattern has been bullish continuation which we've been observing loony losing and dollar gaining consistently along with crude slumps as well. It is now looking to halt the correction mood and shifting back into the business.
Generally this pattern will have a powerful move of some 10 to 24 months which we already saw since October 2012, for now the pair is heading towards a market correction mood. The pair will likely sell off into the correction in a downward fashion for maybe 20 to 35% off the old high point. The time factor is generally anywhere from 8 to 12 weeks depending on the overall market condition. Hence, the overall uptrend in long run remains intact despite the reasonable corrections in short to medium term trend.

- News

- Economy

- Central Banks
- Investing
- Research
- Roundups
- Digital Currency
- Insights
- Technical Analysis
- Technology
- Business
- Law
- Health
- Nature
- Fintech
- Science
- Topic
- Opinions
- ©Econometrics LLC . All Rights Reserved.
FxWirePro: USD/CAD testing trendline support to surge again, saucer pattern suggests long term uptrend remains intact
Friday, August 28, 2015 1:53 PM UTC
Editor's Picks


- Market Data
Most Popular


