


 FxWirePro- Woodies pivot (Major)
  FxWirePro: GBP/NZD remains weak, eyes 38.2%fib support
  JPY Currency Meter Signals: NZDJPY Bullish (+25) vs CHFJPY (-100) – These Pairs Could Move Next
  AUD/JPY Slips Below 112 as BOJ Intervention Sparks Bearish Momentum: Sell the Rallies
  FxWirePro- Woodies pivot (Major)
  FxWirePro: GBP/AUD drifts lower after BOE rate decision
  FxWirePro: USD/CAD retreats after Canada posts stronger-than-expected GDP growth
  NZDJPY Retreats on Yen Strength – Bearish Setup Targets 90 After Hitting 92.75 Low
  US Magnificent 7 Stocks Trend Score: Amazon & Microsoft Hit Extreme Bullish (+100) as Meta Drops to -100 — Key Resistance & Support Watchlist
  FxWirePro- Major Pair levels and bias summary
  FxWirePro: EUR/ AUD dips below 1.6400 level, focus on near term support
  FxWirePro: USD/CNY dips to hit three year low,scope for further downside
  Major FX Action Bias & US Market Sentiment: NZD/USD (Extremely Bullish) & AUD/USD (Bullish) Watchlist
  NZDJPY Bullish Rebound: Buy Dips as EMAs Align for 97 Target
  FxWirePro- Major Pair levels and bias summary
  AUDJPY Volatile After Massive Sell-Off: Sell Rallies at 113, Targeting 110 as Bearish Momentum Surges
  FxWirePro: GBP/USD rises as soft US data pressures dollar


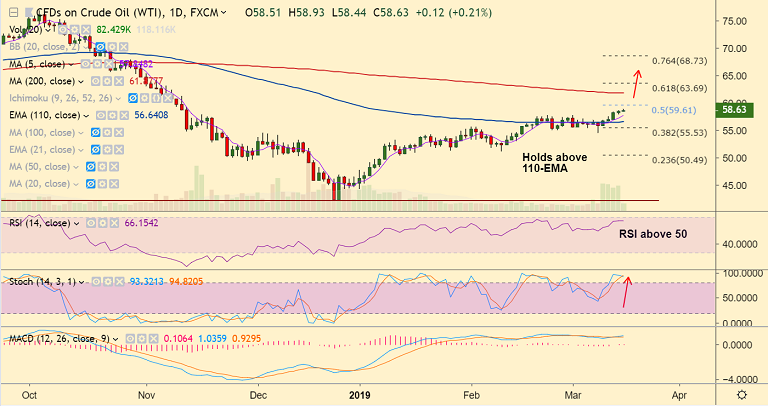
U.S. oil chart - Trading View
- U.S. oil extends break above 110-EMA, hits new 4-month tops shy of 59 handle.
- Potential deficit in the global supplies in the first quarter of 2019 supporting prices higher.
- Latest EIA report shows bigger-than-expected drop in the US EIA weekly crude stockpiles.
- Also, a decline in the US oil production propelled the black gold further to the north.
- Price action has bounced off 55-EMA with a 'hammer' formation. We see weakness only below 55-EMA.
- Technical indicators have turned slightly bullish. Decisive break above 110-EMA has raised scope for further gains.
- Next major resistance above 110-EMA lies at 50% Fib at 59.60. Retrace below 110-EMA and break below 55-EMA can see dip till daily cloud.
Support levels - 56.53 (110-EMA), 55.53 (38.2% Fib), 54.85 (55-EMA)
Resistance levels - 57.85 (Mar 1 high), 59.61 (50% Fib), 61.97 (200-DMA)
Call update: Our previous call (https://www.econotimes.com/FxWirePro-US-oil-bounces-of-55-EMA-with-Hammer-formation-stay-long-on-close-above-110-EMA-1508943) has hit TP1.
Recommendation: Hold for targets.
For details on FxWirePro's Currency Strength Index, visit http://www.fxwirepro.com/currencyindex.


