


 Urban studies: Doing research when every city is different
  Lithium Market Poised for Recovery Amid Supply Cuts and Rising Demand
  Indonesia Surprises Markets with Interest Rate Cut Amid Currency Pressure
  FxWirePro: GBP/AUD sustains gains as uptrend remains strong
  FxWirePro: AUD/USD drifts lower, uninspired by jobs beat
  Mexico's Undervalued Equity Market Offers Long-Term Investment Potential
  US Futures Rise as Investors Eye Earnings, Inflation Data, and Wildfire Impacts
  FxWirePro: USD/CNY hits one –month high, scope for further upside
  Moldova Criticizes Russia Amid Transdniestria Energy Crisis
  Gold Prices Fall Amid Rate Jitters; Copper Steady as China Stimulus Eyed
  U.S. Treasury Yields Expected to Decline Amid Cooling Economic Pressures
  BTC Slips Below $60K as Institutional Demand Dries Up — Bears Eye $59K Support, Rallies to $63K for Shorts
  FxWirePro: GBP/AUD steadies around 0.9145 ,retains bid tone
  S&P 500 Relies on Tech for Growth in Q4 2024, Says Barclays
  US Gas Market Poised for Supercycle: Bernstein Analysts
  FxWirePro: USD/CAD hits 14-month high , Scope for further upside
  FxWirePro- Woodies pivot (Major)


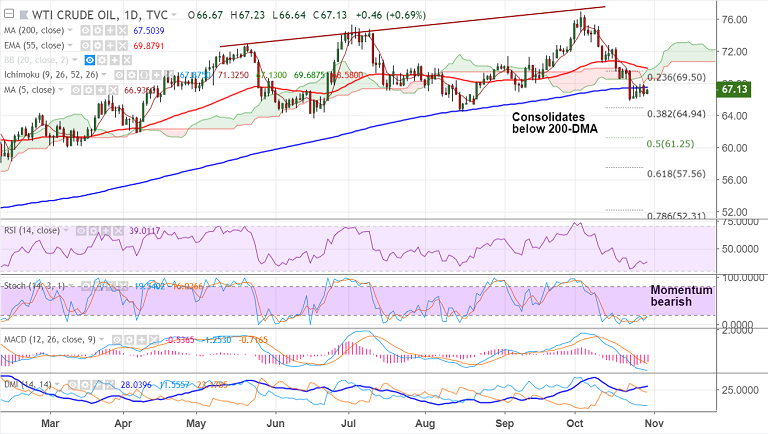
US oil chart on Trading View used for analysis
- US oil is extending consolidation below 200-DMA, bias remains bearish.
- WTI price holds above $67 per barrel and we see further gains on retrace above 200-DMA.
- Markets remain wary about the recovery amid global economic growth concerns, ongoing US-China trade war and the European political woes.
- Technical indicators on intraday charts are neutral, but break above 200-DMA could see some bullishness.
- 5-DMA has turned north and retrace above 200-DMA eyes 110-EMA at 69 ahead of 55-EMA at 69.87.
- Rejection at 200-DMA could see continuation on downside. Next major bear target lies at 38.2% Fib at 64.94.
- Focus on the US core PCE data and weekly US fuel stocks report for the next direction in the prices.
Support levels - 66.93 (5-DMA), 66, 64.94 (38.2% Fib)
Resistance levels - 67.50 (200-DMA), 69 (110-EMA), 69.87 (55-EMA)
For details on FxWirePro's Currency Strength Index, visit http://www.fxwirepro.com/currencyindex.


