


 FxWirePro: GBP/NZD range to extend until there is game changing news
  Aussie Retreats Against the Yen: AUDJPY Bears Target 108 as 110 Resistance Holds Firm
  FxWirePro: USD/ZAR sustains gains as uptrend remains strong
  FxWirePro: EUR/AUD eases slightly but trend is still bullish
  FxWirePro: EUR/AUD gaining momentum for a move towards 1.6800 level
  Ethereum Retreats Toward USD 2,000: Technicals Signal Caution as ETH Mimics Bitcoin’s Pullback
  EUR/JPY Bulls Charge: Eyeing 186.00 as Euro Strength Intensifies
  FxWirePro: USD/ZAR fibo rejection triggers sizeable pullback
  FxWirePro: EUR/ NZD steadies around 2.0150, retains bid tone
  FxWirePro: GBP/USD outlook weaker on renewed downside pressure
  FxWirePro: EUR/ NZD consolidating around 2.0180 room for further gains
  FxWirePro- Major European Indices
  FxWirePro: GBP/USD recovers but bears are not done yet again
  FxWirePro:NZD/USD drifts lower, could be on verge of bigger drop
  Euro Retreats as Geopolitical Tensions Surge: EURUSD Eyes 1.1400 Floor Amid Safe-Haven Demand


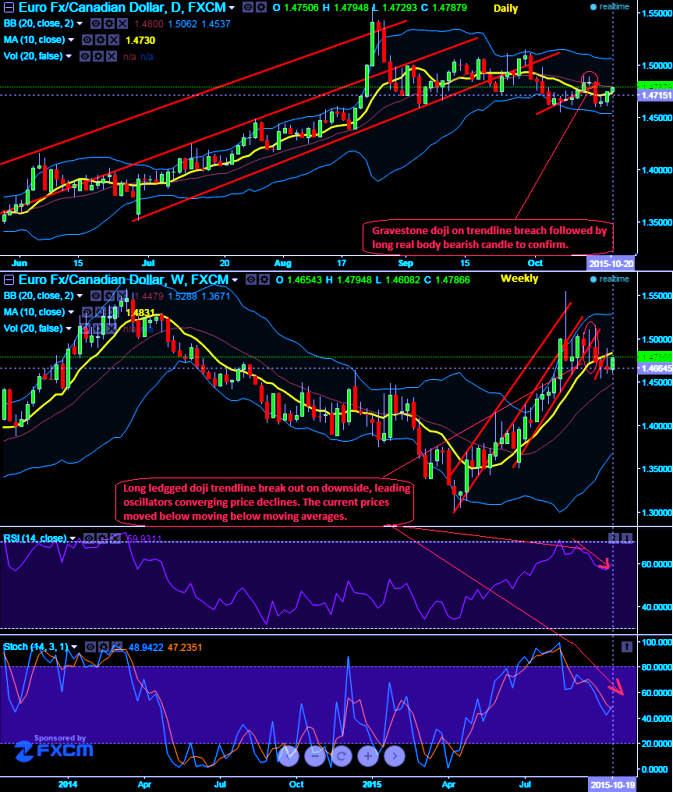
On both weekly and daily charts of EURCAD, we spot out Doji pattern candles formed to highlight a caution for bulls. As you can observe Doji on weekly charts has occurred exactly on a trendline breach at around 1.4909 levels which is to be considered as a caution of previous of upswings.
On daily chart, again a sharp Doji is formed at 1.4838 levels followed by a long real body bearish candle has formed to fall below moving average curve.
In addition to that leading oscillators are showing convergence with the price dips on weekly chart. RSI (14) looks healthily converging with every price declines at 59.9291; it has been showing the same indication right from overbought territory. So, RSI signifies the prevailing down streaks may sustain for some slumps.
While another leading oscillator (slow stochastic) hints us the overbought heaviness through %D crossover above 80 levels which overbought zone though the bulls don't seem to lose rallies built by healthy volumes. Hence, we could see our next targets at 1.4525 levels on south.

- News

- Economy

- Central Banks
- Investing
- Research
- Roundups
- Digital Currency
- Insights
- Technical Analysis
- Technology
- Business
- Law
- Health
- Nature
- Fintech
- Science
- Topic
- Opinions
- ©Econometrics LLC . All Rights Reserved.
FxWirePro: Trendline breach, bearish candles and oscillators signal EUR/CAD further slumps
Tuesday, October 20, 2015 8:44 AM UTC
Editor's Picks


- Market Data
Most Popular


