


 Smartphones are helping filmmakers tell the stories the movie industry overlooks
  Gold Surges Past $4150 on Dovish Fed Signals and Weak Jobs Data; Bullish Outlook Prevails
  Bank of America Upgrades T-Mobile to Buy, Says LEO Satellite Fears Are Overdone
  AI can be a personal trainer in your pocket – but is it safe?
  Trump has made more than $1 billion from crypto in a year. How?
  State of emergency in Crimea as Ukraine focuses pressure on ‘jewel in Putin’s crown’
  Buy the Dip: Gold Holds Strong at $3980, Targets $4150
  Morgan Stanley Names BAE Systems Top European Defence Stock Despite Lower Price Target
  Michael Burry Shorts Tesla at $416 as AI and Semiconductor Bearish Bets Expand
  Vietnam’s population hit the 100 million milestone. Where’s it headed?
  Elon Musk is remaking the world, like Henry Ford before him – but more dangerously


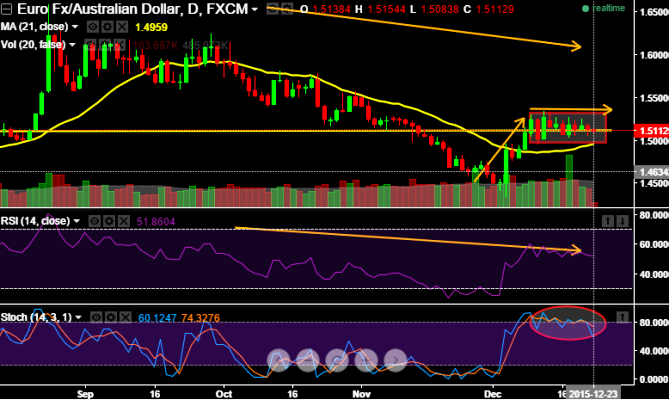
The pair has moved in narrow range (1.50 - 1.5343) after breaking supports at 1.5116 levels.
Leading oscillators on daily showing divergence to the previous short term uptrend and on monthly charts are converging these bearish sentiments.
RSI curve is steeply trending below at 49.9856 and %D line crossover has been maintaining beautifully near 45 levels, (current %D is at around 43.4355 and %K is at 39.7666) but there has been slight divergence on weekly charts.
In our opinion on these technical reasoning creates best swing trading opportunity, it is better to use these rallies and stay calm with earlier ITM long puts and any minor upswings can be utilized OTM put writings.
Most likely scenario: Decline to retest towards 1.5010.
Adverse scenario: Alternatively, it can even test 1.5275.
Overall now the pair is inching towards little upwards slowly, while weekly leading oscillators puzzle by signaling divergence to the dropping prices.

- News

- Economy

- Central Banks
- Investing
- Research
- Roundups
- Digital Currency
- Insights
- Technical Analysis
- Technology
- Business
- Law
- Health
- Nature
- Fintech
- Science
- Topic
- Opinions
- ©Econometrics LLC . All Rights Reserved.
FxWirePro: Swing trading opportunities in EUR/AUD’s sideway trend
Wednesday, December 23, 2015 9:15 AM UTC
Editor's Picks


- Market Data
Most Popular


