


 World Cup technology: from ref cams to AI analysts, cutting-edge research is changing the game
  Silver Cracks Key 365-Day EMA for First Time Since Feb 2024; Bears Eye $50 on Rallies
  How Donald Trump has changed the way diplomacy is done
  Gold's 365-Day EMA Streak Since Oct 2023 Faces Its First Real Test at $3,980 — Break or Bounce to $4,140?
  AI Memory Boom Sparks Global Chip Supply Crunch
  J.P. Morgan Sees Potential Vestas Guidance Upgrade Amid Strong Wind Energy Demand
  Trump’s Iran Strategy: What Has Been Achieved After Three Months of Conflict?


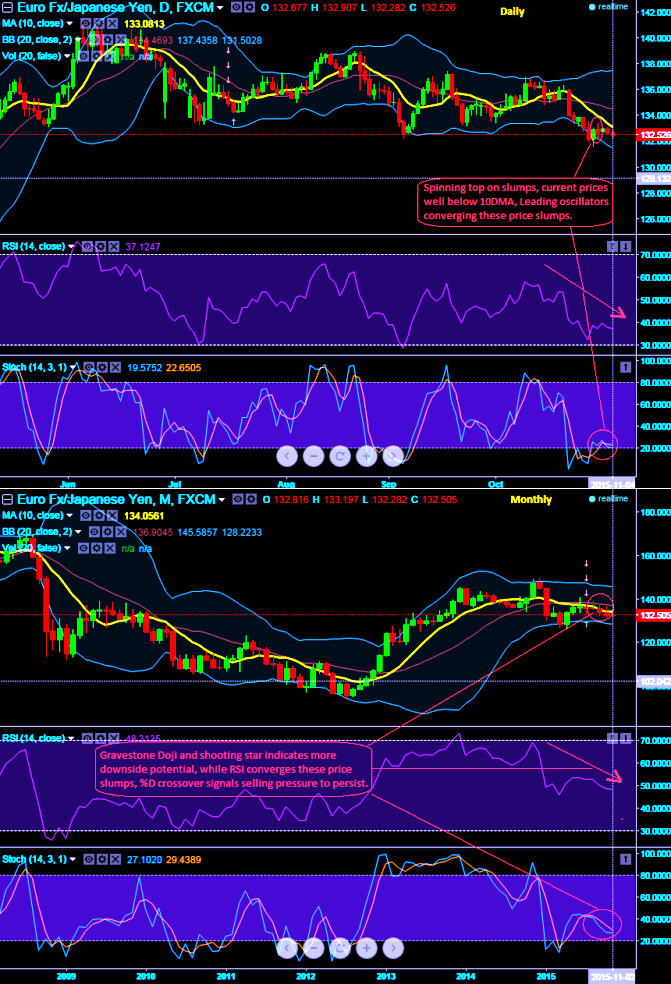
EUR/JPY is boiling up with lots of bearish candles, such as bearish spinning top at 132.700 levels on daily chart. So, traders must wait and see the next price movement. In an uptrend, if a bullish candle forms after the Spinning Top pattern at a support level, it could be used as an entry point.
Considering previous immediate downtrend, bearish candle forms followed by this Spinning Top at 132.700 resistance level, hence it could be used as an exit point.
Gravestone Doji and candle resembling a shooting star on monthly occurred at 135.870 and 132.700 respectively.
It's advisable to use a combination of patterns and indicators to determine your trading strategy.
As a result, these bearish patterns signal more downside potential upto 132.153 levels.
Currently, RSI (14) trending near 37.1247 levels with downward convergence with dipping prices.
Although the there is no sign of either overbought or oversold situation, it alarms bears trying to take over the declining rallies as the slow stochastic noises with %D line cross over around 30 levels on weekly (current %D line flashes at 29.4389).

- News

- Economy

- Central Banks
- Investing
- Research
- Roundups
- Digital Currency
- Insights
- Technical Analysis
- Technology
- Business
- Law
- Health
- Nature
- Fintech
- Science
- Topic
- Opinions
- ©Econometrics LLC . All Rights Reserved.
FxWirePro: Spinning top, Doji patterns signal EUR/JPY weakness - more downside potential upto 132 regions
Wednesday, November 4, 2015 10:16 AM UTC
Editor's Picks


- Market Data
Most Popular


