


 Ethereum Consolidates: Bullish Technicals Point to a Potential $3,000 Breakout
  FxWirePro: USD/CNY neutral in the near-term, scope for downward resumption
  FxWirePro: GBP/NZD down trend loses steam, remains on bearish path
  FxWirePro: AUD/USD retreats slightly but trend is still bullish
  FxWirePro- Woodies Pivot(Major)
  FxWirePro: USD/JPY holding bid into weekend
  FxWirePro: USD/CAD recovers slightly but bearish outlook persists
  FxWirePro- Major Pair levels and bias summary
  FxWirePro: EUR/AUD under pressure as key support gives way
  FxWirePro- Major Crypto levels and bias summary
  FxWirePro- Woodies Pivot(Major)
  FxWirePro: USD/CAD extends decline on broad dollar weakness
  FxWirePro: GBP/USD biased higher but rally currently stretched
  FxWirePro: USD/ZAR recovers slightly but trend is still bearish
  Bitcoin’s Volatile Reset: ETFs Rebound as Bulls Eye USD 80,000 Milestone


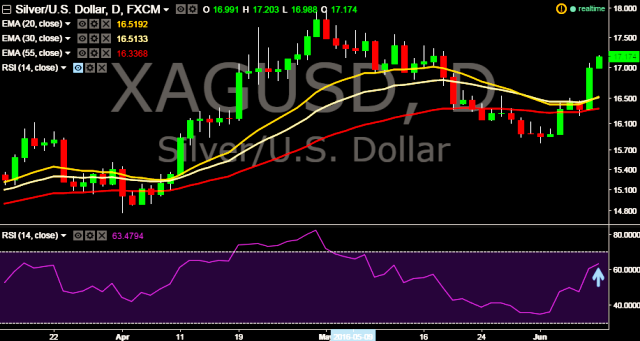
- XAG/USD is currently trading around $17.17 marks.
- It made intraday high at $17.20 and low at $16.98 levels.
- Intraday bias remains bullish till the time pair holds key support at $16.98 marks.
- A daily close below $16.98 will take the parity down towards key support at $16.88, $16.76, $16.63 and $16.32 marks respectively.
- Alternatively, current upward trend will take the parity higher towards key resistances at $17.25, $17.32 and $17.45 marks respectively.
- Important to note here that in a daily chart, 20D, 30D and 55D EMA heads up and confirms bullish trend.
We prefer to take long position in XAG/USD at $17.15, stop loss $16.98 and target $17.35/ $17.42 marks.


