


 Citi Raises TSMC Price Target as AI Chip Demand Strengthens Growth Outlook
  Vietnam’s population hit the 100 million milestone. Where’s it headed?
  Elon Musk is remaking the world, like Henry Ford before him – but more dangerously
  Alcohol is one of the most dangerous drugs, yet its presence is ubiquitous in social settings and celebrations
  State of emergency in Crimea as Ukraine focuses pressure on ‘jewel in Putin’s crown’
  AI can be a personal trainer in your pocket – but is it safe?
  Bernstein Names IAG, Ryanair as Top European Airline Stocks Ahead of Earnings
  Gold Pulls Back After Hitting $4,180 as Geopolitical Risk Sends Crude Higher
  Bank of America Upgrades T-Mobile to Buy, Says LEO Satellite Fears Are Overdone
  Smartphones are helping filmmakers tell the stories the movie industry overlooks
  Trump has made more than $1 billion from crypto in a year. How?


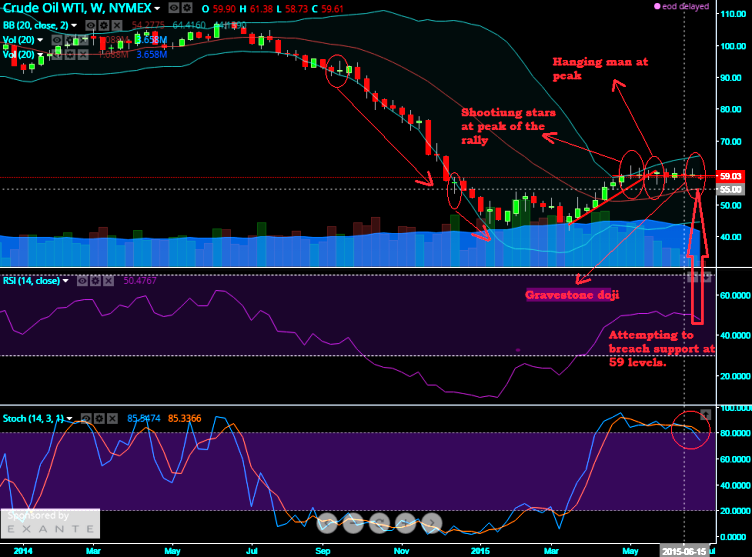
Technical glimpse:
The hanging man pattern which was occurred at 60.30 levels at the end of May needed a confirmation, now that has been backed up by both oscillating indicators (RSI & stochastic) showing downward convergence with the falling price and flurry of bearish candlestick patterns have been displayed back to back.
The hanging man followed by shooting star patterns displayed at around 59.17 levels with long upper shadow and its small real body is at or near the lows of the session. Shooting Star shows trouble overhead. Because of the Shooting Stars long bearish upper shadow, we don't need any confirmation like the Hanging man.
We believe it is testing support at 59 levels if it manages to break then we see all chances dragging until 55 levels.
On weekly graph, CL1! futures is a sell as slow stochastic shows signs of overbought pressures. %D line crossover above 80 level indicates the boiling pressures of overbought scenes. (%D line at 80.9394 & %K line at 74.4366). So fresh short build ups can be seen at current levels for a target upto 57.5 and even upto 55 levels in medium terms.

- News

- Economy

- Central Banks
- Investing
- Research
- Roundups
- Digital Currency
- Insights
- Technical Analysis
- Technology
- Business
- Law
- Health
- Nature
- Fintech
- Science
- Topic
- Opinions
- ©Econometrics LLC . All Rights Reserved.
FxWirePro: Series of bearish candles fuel downside risks in US crude; short crude futures for TP at 55
Wednesday, July 1, 2015 1:25 PM UTC
Editor's Picks



- Market Data
Most Popular




