


 FxWirePro : AUD/USD drifts lower, could be on verge of bigger drop
  FxWirePro- Major Pair levels and bias summary
  FxWirePro- Major Crypto levels and bias summary
  FxWirePro: AUD/USD drifts lower, uninspired by jobs beat
  FxWirePro : GBP/NZD uptrend loses steam, remains on bullish path
  FxWirePro: USD/ZAR remains buoyant, looks to extend gains
  FxWirePro: USD/CAD hits 14-month high , Scope for further upside
  FxWirePro- Woodies pivot (Major)
  AUDJPY Bears Take a Breather at 111.50, But ‘Sell on Rallies’ Still Eyes 110
  ETH Bounces as Shorts Cover, Yet ETF Bleed Warns $1,850 Resistance Won’t Break
  FxWirePro:NZD/USD rout continues without relief
  NZDJPY Bears Reload as 92 Resistance Caps Bounce; Sell-on-Rallies Eyed Toward 90
  FxWirePro: GBP/AUD sustains gains as uptrend remains strong
  Bitcoin Sheds $491M in ETF Outflows and Retreats Below $64K; Sellers Reload for $50K
  FxWirePro- Woodies pivot (Major)


We study CAD valuations by using a multi-disciplined approach that incorporates a combination of fundamental and technical analysis.
Technically, Loony has shown a strong signs of recovery as monthly charts pops up with a sharp shooting star formation with leading oscillators showing downward convergence. We reassess the valuation backdrop in the context of a sharp rise in USD/CAD to 1.4690 to begin the year, followed by an equally sharp pullback to 1.3639 in early February.
However, the present-day situation has USD/CAD trading to almost 12-year high as crude oil prices forge a new cycle low below /bbl in the aftermath of OPEC failing to agree to new quotas at their recent meeting in Tehran.
Despite crude's attempts of forming bottoms, we could still see some analysts pointing commodity direction at below $25 a barrel. This should maintain headwinds for the Canadian economy as we enter 2016, with GDP growth hampered by additional cuts to energy capital expenditures which, in turn, detract from business investment.
With many clients forced to grapple with this volatility, our efforts to conclude whether the risks to USD/CAD are symmetric or asymmetric in nature with respect to various valuation metrics. Misalignment on most measures is currently minimal and points to symmetrical price risks. Key support at 1.3629 serves as a pivot for the uptrend that has been in place for USD/CAD since last May.
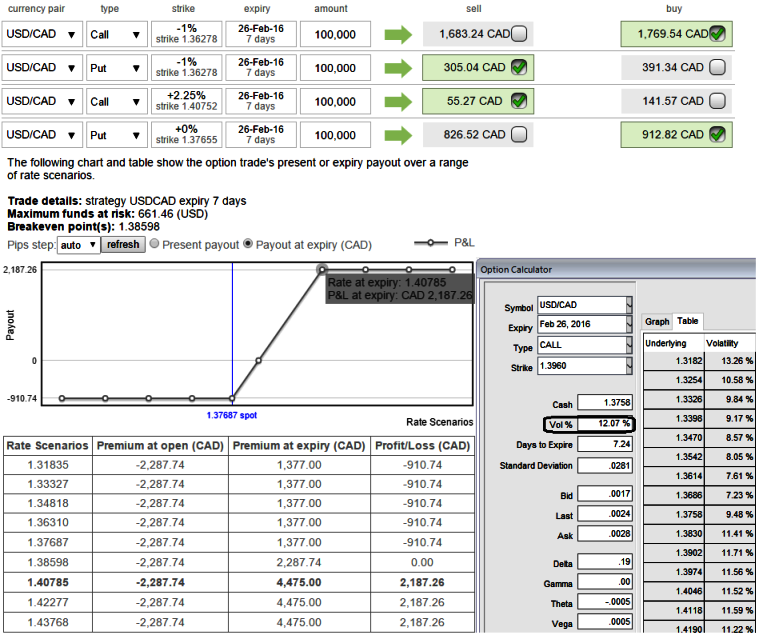
Hedging Framework: Jelly Roll Options Combinations
Spread ratio: (Sell 1: Buy 1: Buy 1: Sell 1)
Strategy Construction:
Go Short in 1W OTM strike call with positive theta
Go Long in ITM strike -0.71 delta put of the same expiry (1.4075/1.4075),
Simultaneously,
Go Long in 1M ITM strike 0.74 delta call
Go Short in OTM strike put of the same expiry with positive theta (1.3639/1.3649)
This overall position creates a synthetic near-term short position and long-term long position that work to capitalize upon the time differential between underlying futures prices.
Strike configuration:
Leg 1 strike = Leg 2 strike
Leg 3 strike = leg 4 strike
Leg 3 strike ≠ leg 1 strike
Leg Expiration:
Leg 1 expiration = leg 2 expiration
Leg 3 expiration = leg 4 expiration
Leg 1 expiration < leg 3 expiration
Please be noted that the expiries shown in the diagrams are for demonstration purpose only.

- News

- Economy

- Central Banks
- Investing
- Research
- Roundups
- Digital Currency
- Insights
- Technical Analysis
- Technology
- Business
- Law
- Health
- Nature
- Fintech
- Science
- Topic
- Opinions
- ©Econometrics LLC . All Rights Reserved.
FxWirePro: Roll out with "Jelly rolls option combinations" for hedging USD/CAD's puzzling swings
Friday, February 19, 2016 9:47 AM UTC
Editor's Picks


- Market Data
Most Popular


