


 Ethereum’s Healthy Correction: Bulls Eye Strategic Re-Entry at 2,150 USD Following Profit-Booking Pullback
  FxWirePro: AUD/USD retreats slightly but trend is still bullish
  FxWirePro- Major Pair levels and bias summary
  Aussie Consolidates After Peak: AUDJPY Bulls Eye a Strategic Entry for the 115.00 Target
  FxWirePro: EUR/CAD gains ground on prospects of resumed energy flows
  FxWirePro: EUR/AUD claws back some losses but rcovery likely muted
  FxWirePro: USD/ZAR edges lower ,investors remain on edge
  NZDJPY Bulls Charge Toward 95.00: Safe-Haven Exodus Drives Kiwi Rally
  FxWirePro: USD/JPY holding bid into weekend
  Kiwi Ascendant: NZDJPY Bulls Eye Multi-Year Peaks Amid Triple-Day Rally
  Bitcoin’s Islamabad Watch: BTCUSD Consolidates Near 71,421 USD as Geopolitical Peace Talks Loom
  Bitcoin’s Volatile Reset: ETFs Rebound as Bulls Eye USD 80,000 Milestone
  FxWirePro- Major Crypto levels and bias summary
  FxWirePro: EUR/NZD remains under pressure as key support gives way
  FxWirePro: USD/JPY steadies around 158.75, bias bullish
  FxWirePro: GBP/AUD positions for another drop, eyes 1.8900level
  FxWirePro- Woodies Pivot(Major)


- Demand for risk assets are on the rise on the news that European leaders have reached an agreement on migration.
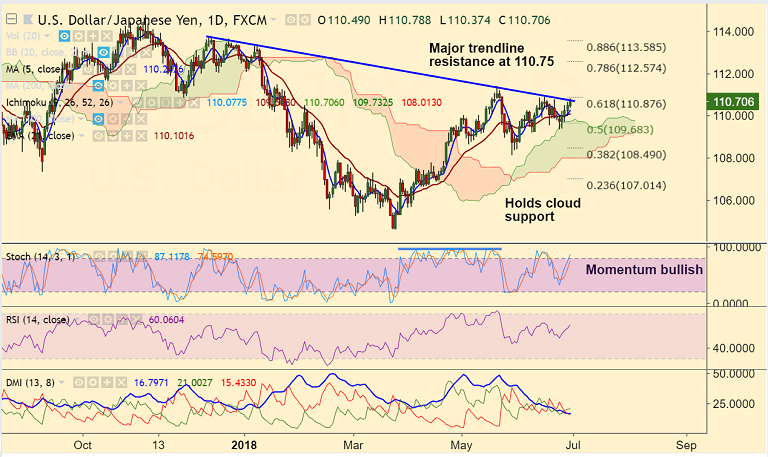
- USD/JPY hit 2-week highs at 110.78 before paring some gains to currently trade at 110.70.
- The pair finds major trendline resistance at 110.75, break above could propel the pair higher.
- Technical indicators on daily charts are biased higher. Stochs show bullish momentum and RSI strong above 60.
- Breakout at trendline resistance likely to see test of 111.40 (May 21 high) ahead of 112.57 (78.6% Fib).
- On the flipside, rejection at trendline resistance to see retrace till 21-EMA (110.10). Break below daily cloud to negate bullish bias.
Support levels - 110.17 (200-DMA), 110.10 (21-EMA), 109.73 (cloud top)
Resistance levels - 110.75 (trendline resistance), 111, 111.40 (May 21 high)
Recommendation: Good to go long on breakout at trendline resistance (110.75), SL: 110.15, TP: 111/ 111.40/ 112
FxWirePro Currency Strength Index: FxWirePro's Hourly USD Spot Index was at -22.1814 (Neutral), while Hourly JPY Spot Index was at -176.673 (Bearish) at 0345 GMT. For more details on FxWirePro's Currency Strength Index, visit http://www.fxwirepro.com/currencyindex.


