


 FxWirePro- Major Pair levels and bias summary
  FxWirePro: USD/ZAR gains as stronger dollar outweighs upbeat South Africa's trade surplus
  FxWirePro: USD/CAD retreats after Canada posts stronger-than-expected GDP growth
  NZDJPY Retreats on Yen Strength – Bearish Setup Targets 90 After Hitting 92.75 Low
  FxWirePro- Major Crypto levels and bias summary
  FxWirePro: GBP/AUD drifts lower after BOE rate decision
  FxWirePro- Major Pair levels and bias summary
  Nikkei Surges Past 65,000 on Suspected Yen Weakness: Tech Giants Like Advantest and NEC Lead Explosive Gains
  JPY Currency Meter Signals: NZDJPY Bullish (+25) vs CHFJPY (-100) – These Pairs Could Move Next
  FxWirePro: EUR/ AUD dips below 1.6400 level, focus on near term support
  US Magnificent 7 Stocks Trend Score: Amazon & Microsoft Hit Extreme Bullish (+100) as Meta Drops to -100 — Key Resistance & Support Watchlist
  US Magnificent 7 Stocks Trend Score: Amazon & Microsoft Hit Extreme Bullish (+100) as Meta Drops to -100 — Key Resistance & Support Watchlist
  All Major JPY Pairs Hit Extreme Bearish Score of -100: USDJPY, EURJPY, GBPJPY, AUDJPY, NZDJPY & CADJPY Flash Maximum Weakness
  FxWirePro: GBP/USD rises as soft US data pressures dollar
  Major European Indices Score Extremely Bullish: DAX Eyes 26000, CAC Targets 8600, FTSE100 at 11000 – Key Levels to Watch
  FxWirePro- Major Crypto levels and bias summary


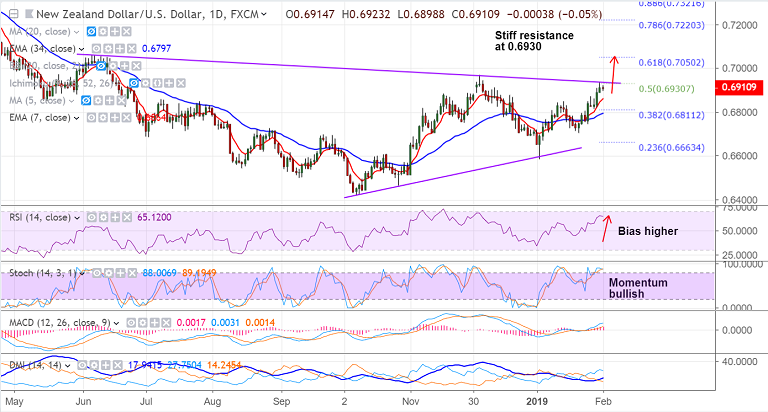
NZD/USD chart on Trading View used for analysis
- NZD/USD is trading in a narrow range with session highs at 0.6923 and lows at 0.6898.
- The pair is consolidating below major trendline resistance at 0.6930 and breakout above will see bullish continuation.
- Technical studies are bullish and we do not see major reversal signs on the charts.
- Breakout at 0.6930 (trendline resistance) will see test of 61.8% Fib at 0.7050.
- On the flipside, 5-DMA is immediate support at 0.6876. Break below 200-DMA will see bullish invalidation.
- Focus remains on U.S. NFP data for further impetus. A big beat on expectations could put a bid under the USD.
Call update: Our previous call (https://www.econotimes.com/FxWirePro-NZD-USD-extends-gains-above-069-handle-bullish-continuation-likely-above-06930-1491846) has hit TP1.
Recommendation: Book partial profits at highs. Watch out for break above 0.6930 for further bullishness.
For details on FxWirePro's Currency Strength Index, visit http://www.fxwirepro.com/currencyindex.


