


 FxWirePro: GBP/AUD steadies around 0.9145 ,retains bid tone
  US Futures Rise as Investors Eye Earnings, Inflation Data, and Wildfire Impacts
  Goldman Predicts 50% Odds of 10% U.S. Tariff on Copper by Q1 Close
  US Gas Market Poised for Supercycle: Bernstein Analysts
  Urban studies: Doing research when every city is different
  FxWirePro- Major Pair levels and bias summary
  ETH Bounces as Shorts Cover, Yet ETF Bleed Warns $1,850 Resistance Won’t Break
  Fed May Resume Rate Hikes: BofA Analysts Outline Key Scenarios
  UBS Predicts Potential Fed Rate Cut Amid Strong US Economic Data
  FxWirePro:NZD/USD rout continues without relief
  U.S. Treasury Yields Expected to Decline Amid Cooling Economic Pressures
  U.S. Banks Report Strong Q4 Profits Amid Investment Banking Surge
  European Stocks Rally on Chinese Growth and Mining Merger Speculation
  FxWirePro: GBP/AUD sustains gains as uptrend remains strong
  Moldova Criticizes Russia Amid Transdniestria Energy Crisis
  FxWirePro: USD/CNY hits one –month high, scope for further upside
  NZDJPY Bears Reload as 92 Resistance Caps Bounce; Sell-on-Rallies Eyed Toward 90


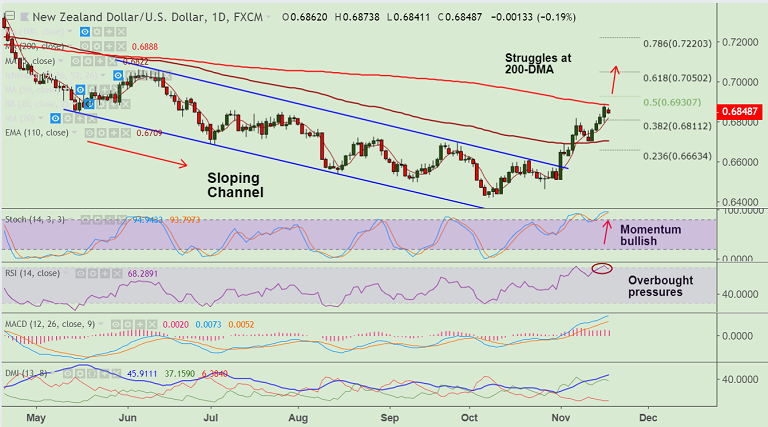
NZD/USD chart on Trading View used for analysis
- NZD/USD slips further from 5-month high at 0.6883 hit on Friday's trade.
- The pair is struggling at stiff resistance at 200-DMA, further upside only on break above.
- We see some overbought pressures on momentum indicators which suggests possibility of pullbacks.
- Immediate support lies at 5-DMA at 0.6820, break below to see dip till 110-EMA at 0.6709.
- On the upside, breakout at 200-DMA to see test of 61.8% Fib at 0.7050.
Support levels - 0.6820 (5-DMA), 0.6709 (110-EMA)
Resistance levels - 0.6888 (200-DMA), 0.7050 (61.8% Fib)
For details on FxWirePro's Currency Strength Index, visit http://www.fxwirepro.com/currencyindex.


