


 FxWirePro- Major Crypto levels and bias summary
  Major European Indices Score Extremely Bullish: DAX Eyes 26000, CAC Targets 8600, FTSE100 at 11000 – Key Levels to Watch
  US Magnificent 7 Stocks Trend Score: Amazon & Microsoft Hit Extreme Bullish (+100) as Meta Drops to -100 — Key Resistance & Support Watchlist
  FxWirePro- Major Pair levels and bias summary
  FxWirePro: GBP/AUD drifts lower after BOE rate decision
  FxWirePro: AUD/USD gains some ground but outlook is bearish
  FxWirePro: USD/CNY dips to hit three year low,scope for further downside
  FxWirePro: NZD/USD consolidates overnight gains, but loses momentum
  FxWirePro- Major Pair levels and bias summary
  JPY Currency Meter Signals: NZDJPY Bullish (+25) vs CHFJPY (-100) – These Pairs Could Move Next
  FxWirePro: GBP/AUD bears maintain upper hand
  Major FX Action Bias & US Market Sentiment: NZD/USD (Extremely Bullish) & AUD/USD (Bullish) Watchlist
  US Magnificent 7 Stocks Trend Score: Amazon & Microsoft Hit Extreme Bullish (+100) as Meta Drops to -100 — Key Resistance & Support Watchlist
  FxWirePro: EUR/ AUD dips below 1.6400 level, focus on near term support
  FxWirePro- Major Crypto levels and bias summary
  Nikkei Surges Past 65,000 on Suspected Yen Weakness: Tech Giants Like Advantest and NEC Lead Explosive Gains


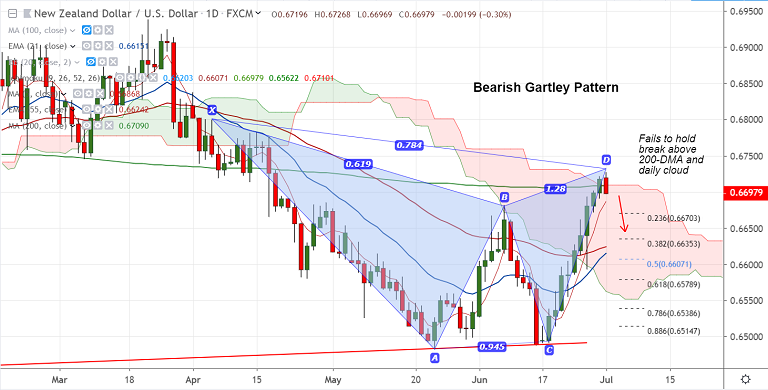
NZD/USD chart - Trading View
NZD/USD trades 0.31% lower on the day at 0.6697 at 06:25 GMT.
The pair fails to hold break above 200-DMA and daily cloud, slips below 0.67 handle.
Technical indicators are turning bearish on the intraday charts. Oscillators are on verge of roll back from overbought levels.
Further, a 'Bearish Gartley' pattern formed on the daily charts keeps scope for weakness.
New Zealand’s Treasury report shows lead activity indicators pose downside risk to near-term growth forecasts keeping pressure on the kiwi.
5-DMA is still biased higher and the pair is holding support at 55H EMA. Break below 5-DMA will see downside extension.
Dip till 61.8% Fib at 0.6578 likely. Bearish invalidation only on decisive break above 200-DMA.
Support levels - 0.6686 (5-DMA), 0.6624 (55-EMA), 0.6578 (61.8% Fib)
Resistance levels - 0.6709 (200-DMA), 0.6732 (Upper BB), 0.6753 (55W EMA)
Recommendation: Good to stay short on close below 200-DMA, SL: 0.6735, TP: 0.6625/ 0.6580
For details on FxWirePro's Currency Strength Index, visit http://www.fxwirepro.com/currencyindex.


