


 FxWirePro- Major Pair levels and bias summary
  AUDJPY Volatile After Massive Sell-Off: Sell Rallies at 113, Targeting 110 as Bearish Momentum Surges
  FxWirePro- Woodies pivot (Major)
  NZDJPY Bullish Rebound: Buy Dips as EMAs Align for 97 Target
  JPY Currency Meter Signals: NZDJPY Bullish (+25) vs CHFJPY (-100) – These Pairs Could Move Next
  FxWirePro- Major Crypto levels and bias summary
  AUD/JPY Slips Below 112 as BOJ Intervention Sparks Bearish Momentum: Sell the Rallies
  FxWirePro: GBP/AUD drifts lower after BOE rate decision
  US Magnificent 7 Stocks Trend Score: Amazon & Microsoft Hit Extreme Bullish (+100) as Meta Drops to -100 — Key Resistance & Support Watchlist
  Major FX Action Bias & US Market Sentiment: NZD/USD (Extremely Bullish) & AUD/USD (Bullish) Watchlist
  FxWirePro:USD/JPY climbs back above 160.00 after BOJ rate decision
  FxWirePro- Woodies pivot (Major)
  US Magnificent 7 Stocks Trend Score: Amazon & Microsoft Hit Extreme Bullish (+100) as Meta Drops to -100 — Key Resistance & Support Watchlist
  FxWirePro: GBP/AUD bears maintain upper hand
  FxWirePro: NZD/USD consolidates overnight gains, but loses momentum
  FxWirePro: GBP/NZD remains weak, eyes 38.2%fib support


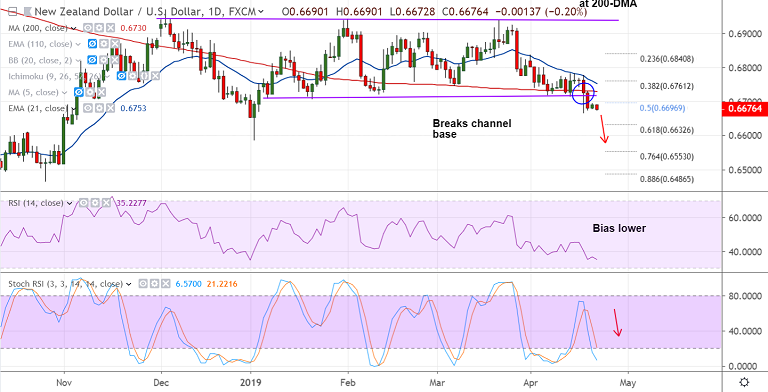
NZD/USD chart - Trading View
- NZD/USD has resumed downside after brief pause on Friday's trade, bias bearish.
- Technical indicators support weakness, RSI and Stochs are sharply lower, MACD and DMI support downside.
- The pair is extending downside after break below 200-DMA and channel base support. Price action below cloud and major moving averages.
- GMMA indicator has indicated a shift in near-term trend. Scope for weakness till 61.8% Fib at 0.6632 and then 0.6585 (Dec 31st low).
- Immediate resistance is seen at 5-DMA at 0.6707. Retrace above 200-DMA will see upside till 21-EMA. Breakout at 21-EMA will see further gains.
Support levels - 0.6632 (61.8% Fib), 0.66, 0.6585 (Dec 31st low)
Resistance levels - 0.6696 (50% Fib), 0.6730 (200-DMA), 0.6753 (21-EMA)
Call update: Our previous call (https://www.econotimes.com/FxWirePro-NZD-USD-holds-support-at-channel-base-good-to-go-short-on-break-below-1526960) has hit TP1.
Recommendation: Trail SL to 0.67. Hold for further downside.
For details on FxWirePro's Currency Strength Index, visit http://www.fxwirepro.com/currencyindex.


