


 FxWirePro: USD/CAD gaining momentum for a move towards 1.4200 level
  FxWirePro: GBP/USD edges higher as traders await BoE guidance and UK fiscal clarity
  EUR/USD Bounces from Monthly Low, But Bearish Pressure Remains
  NZDJPY Pullback: Sell Rallies Toward 93.30 as Yen Weakness Eases
  AUDJPY Action Bias: Bullish Dip-Buy Setup Despite Flat Neutral Bias
  NZDJPY Action Bias: Bullish Dip-Buying Opportunity on Broad Yen Weakness
  FxWirePro: USD/ZAR uptrend loses steam, remains on bullish path
  FxWirePro: GBP/NZD gains some ground but bias is still bearish
  FxWirePro: USD/CAD runs out of steam but maintains bullish outlook
  AUDJPY Weakness Deepens: Sell Rallies Toward 112 as Aussie Dollar Falters
  FxWirePro- Major Pair levels and bias summary
  EUR/JPY Holds Bullish Bias as Euro Extends Recovery
  FxWirePro: EUR/AUD outlook weaker on renewed downside pressure
  FxWirePro- Major Crypto levels and bias summary
  FxWirePro: USD/ZAR retreats but trend is still bullish


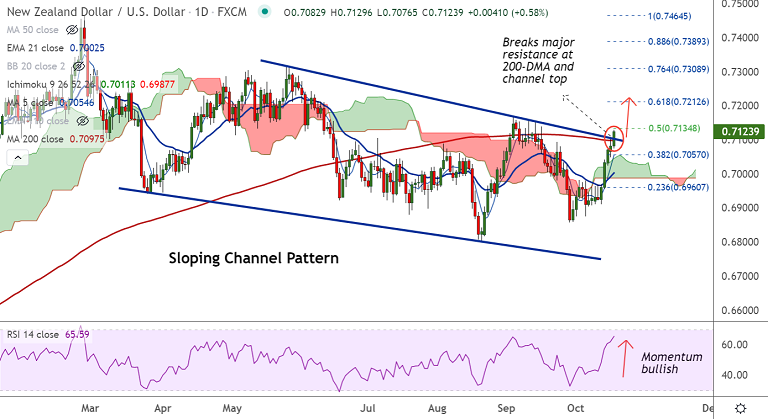
NZD/USD chart - Trading View
Spot Analysis:
NZD/USD was trading 0.60% higher on the day at 0.7125 at around 05:15 GMT
Previous Week's High/ Low: 0.7077/ 0.6911
Previous Session's High/ Low: 0.7105/ 0.7049
Fundamental Overview:
Kiwi tracks Australian dollar higher.
Retreating US bond yields prompted fresh USD selling and provided support to the pair.
The pair finally broke major confluence barrier at 200-DMA and channel top raising scope for further upside.
Monday's disappointing Chinese data which showed that the economic growth decelerated sharply from 7.9% to 4.9% in Q3 dents sentiment and could hamper gains.
Also, prospects for an early Fed taper might help limit any deeper USD losses and cap upside in the pair. Focus on US Housing Start, and Building Permits for impetus.
Technical Analysis:
- NZD/USD has broken major resistance at 200-DMA and channel top
- Momentum is strongly bullish, Stochs and RSI are biased higher
- Volatility is high and rising as evidenced by widening Bollinger bands
- MACD and ADX support further upside in the pair
Major Support and Resistance Levels:
Support - 0.7097 (200-DMA), Resistance - 0.7195 (200-month MA)
Summary: NZD/USD trades with a major bullish bias. Immediate resistance is seen at 50% Fib at 0.7134. Next major resistance lies at 200-month MA at 0.7195.


