


 FxWirePro: NZD/USD consolidates overnight gains, but loses momentum
  FxWirePro: GBP/NZD remains weak, eyes 38.2%fib support
  FxWirePro- Major Crypto levels and bias summary
  US Magnificent 7 Stocks Trend Score: Amazon & Microsoft Hit Extreme Bullish (+100) as Meta Drops to -100 — Key Resistance & Support Watchlist
  FxWirePro- Woodies pivot (Major)
  Major European Indices Score Extremely Bullish: DAX Eyes 26000, CAC Targets 8600, FTSE100 at 11000 – Key Levels to Watch
  FxWirePro: USD/CNY dips to hit three year low,scope for further downside
  FxWirePro: USD/CAD retreats after Canada posts stronger-than-expected GDP growth
  FxWirePro- Major Pair levels and bias summary
  FxWirePro: AUD/USD gains some ground but outlook is bearish
  AUD/JPY Slips Below 112 as BOJ Intervention Sparks Bearish Momentum: Sell the Rallies
  NZDJPY Bullish Rebound: Buy Dips as EMAs Align for 97 Target
  Major FX Action Bias & US Market Sentiment: NZD/USD (Extremely Bullish) & AUD/USD (Bullish) Watchlist
  FxWirePro: GBP/USD rises as soft US data pressures dollar
  JPY Currency Meter Signals: NZDJPY Bullish (+25) vs CHFJPY (-100) – These Pairs Could Move Next
  FxWirePro- Woodies pivot (Major)
  FxWirePro- Major Pair levels and bias summary


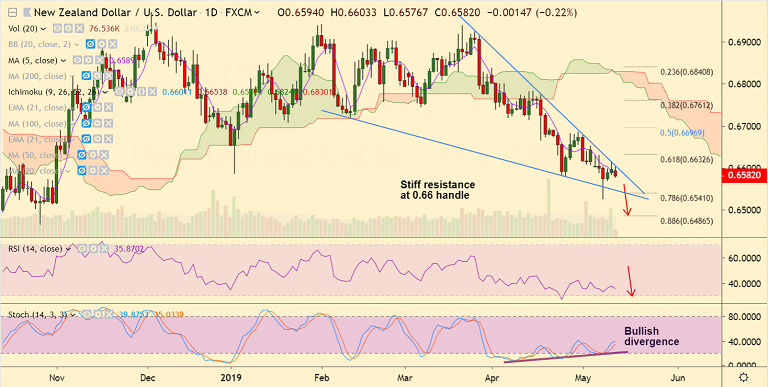
NZD/USD chart - Trading View
- NZD/USD trades 0.27% lower at 0.6579 at 0535 GMT, bias lower.
- The pair has paused recovery, finds stiff resistance at 0.66 (major trendline resistance).
- We see bullish divergence on RSI and Stochs on daily charts that keeps scope for upside.
- However, risk aversion is likely dragging the Kiwi lower as Sino-US trade war shows little signs of de-escalation.
- Also, New Zealand food inflation dropped in April. NZ food inflation increased an annual 1% in April. Month-on-month, however, food prices fell 0.1%, following a 0.5% rise in March.
- Major trend in the pair is bearish. Next major bear target lies at 0.6541 (converged Lower BB and 78.6% Fib).
- On the flipside, break above 0.66 could see test of 21-EMA at 0.6645. Break above 21-EMA targets 200-DMA at 0.6718.
Support levels - 0.6541 (converged Lower BB and 78.6% Fib), 0.65, 0.6486 (88.6% Fib)
Resistance levels - 0.66 (trendline), 0.6632 (61.8% Fib), 0.6641 (21-EMA)
For details on FxWirePro's Currency Strength Index, visit http://www.fxwirepro.com/currencyindex.


