


 FxWirePro: USD/CNY dips to hit three year low,scope for further downside
  FxWirePro: GBP/AUD drifts lower after BOE rate decision
  FxWirePro- Woodies pivot (Major)
  FxWirePro: GBP/USD rises as soft US data pressures dollar
  FxWirePro: USD/CNY downtrend loses steam, remains on bearish path
  FxWirePro- Major Crypto levels and bias summary
  NZDJPY Retreats on Yen Strength – Bearish Setup Targets 90 After Hitting 92.75 Low
  FxWirePro: USD/ZAR gains as stronger dollar outweighs upbeat South Africa's trade surplus
  FxWirePro:USD/JPY climbs back above 160.00 after BOJ rate decision
  FxWirePro: AUD/USD gains some ground but outlook is bearish
  FxWirePro: GBP/NZD remains weak, eyes 38.2%fib support
  FxWirePro- Major Pair levels and bias summary
  FxWirePro: USD/CAD retreats after Canada posts stronger-than-expected GDP growth
  Major European Indices Score Extremely Bullish: DAX Eyes 26000, CAC Targets 8600, FTSE100 at 11000 – Key Levels to Watch
  FxWirePro: GBP/NZD remains weak, eyes 38.2%fib support


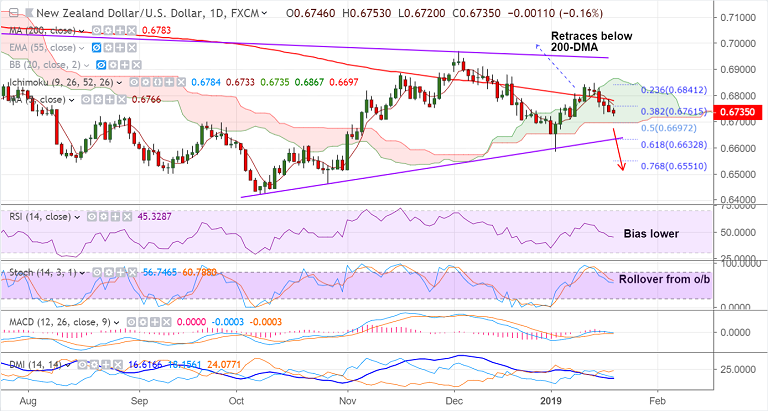
NZD/USD chart on Trading View used for analysis
- NZD/USD is extending weakness for the 6th straight session, bias lower.
- The pair is grinding lower below 200-DMA resistance, trades 0.17% lower at 0.6728 at 0330 GMT.
- Technical studies on intraday charts are biased lower. Stochs have rolled over from overbought levels.
- Price action has retraced break above 200-DMA, has slipped below 110-EMA.
- Next major support lies at 0.6697 (cloud base). Breach below cloud will take the pair lower to next major support at 0.6632 (trendline and 61.8% Fib).
- Focus this week on NZ CPI data. A week print could weigh on kiwi, with markets increasingly expecting a more dovish RBNZ.
Support levels - 0.6697 (cloud base), 0.6632 (converged trendline and 61.8% Fib), 0.6585 (Jan 3 low)
Resistance levels - 0.6751 (110-EMA), 0.6764 (5-DMA), 0.6783 (200-DMA)
Recommendation: Good to stay short on upticks, SL: 0.6775, TP: 0.6750/ 0.67/ 0.6635
For details on FxWirePro's Currency Strength Index, visit http://www.fxwirepro.com/currencyindex.


