


 AUD/JPY Slips Below 112 as BOJ Intervention Sparks Bearish Momentum: Sell the Rallies
  NZDJPY Bullish Rebound: Buy Dips as EMAs Align for 97 Target
  Major Forex Pairs Action Bias: GBPUSD and AUDUSD Turn Extremely Bearish
  EURUSD Spikes to 1.14306 on Fed Pause as Traders Eye Sell-the-Rally Setup
  FxWirePro: GBP/NZD remains weak, eyes 38.2%fib support
  FxWirePro- Major Pair levels and bias summary
  FxWirePro: GBP/USD edges lower ahead of Fed policy verdict
  Buy the Dips on EUR/JPY: Bullish Structure Points to 188 Target Ahead of Fed
  FxWirePro: GBP/AUD drifts lower after BOE rate decision
  FxWirePro- Major Crypto levels and bias summary
  FxWirePro- Woodies pivot (Major)
  JPY Action Bias: EURJPY and CADJPY Emerge as Extremely Bullish Pairs to Watch
  FxWirePro : GBP/NZD strongly bearish despite upside attempts
  FxWirePro- Major Crypto levels and bias summary
  FxWirePro- Major Pair levels and bias summary


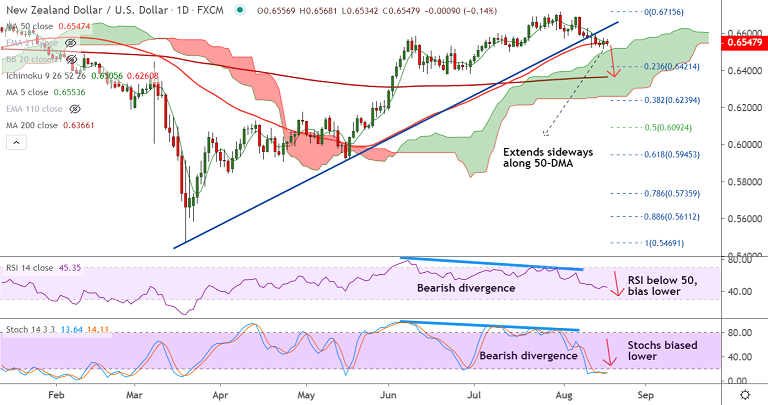
NZD/USD chart - Trading View
NZD/USD was trading 0.13% lower on the day at 0.6548 at around 04:55 GMT.
The pair is extending sideways grind along 50-DMA support, decisive break below will see weakness.
The pair is on a downward streak for the 4th straight week and technical indicators on the daily charts support downside.
A dovish Reserve Bank of New Zealand last week keeps downside pressure on the kiwi. Price action is holding support at weekly cloud and breach below will drag prices lower.
Price action has broken below major trendline support and 'bearish divergence' adds to the bearish bias.
Break below 50-DMA eyes 23.6% Fib at 0.6421. Further weakness will see dip till 200-DMA at 0.6366.







