


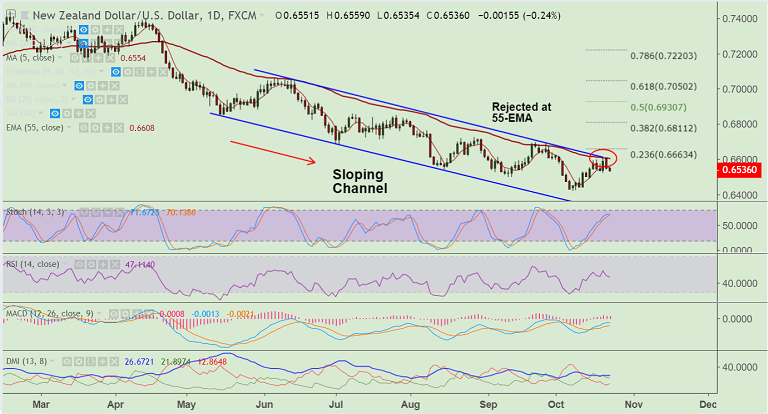
NZD/USD chart on Trading View used for analysis
- NZD/USD is consolidating previous session's slump, scope for further weakness.
- Price was rejected at 55-EMA resistance at 0.6611 on Monday's trade.
- The major has slipped below 5-DMA and is currently trading 0.25% lower on the day.
- The losses the NZD likely associated with the rout in the equity markets.
- On the data front, focus shall be on the September trade balance data published by Statistics New Zealand later this week.
- Also, U.S. Q3 GDP data will have a major influence on the pair's price action.
- Price action continues in downward sloping channel and we see scope for new 2018 lows below 0.6424.
Support levels - 0.6525 (Sept 11 low), 0.6424 (Oct 8 low), 0.6315 (channel base)
Resistance levels - 0.6555 (5-DMA), 0.6609 (55-EMA), 0.67
Recommendation: Stay short on decisive break below 20-DMA, SL: 0.6590, TP: 0.65/ 0.6425/ 0.64
For details on FxWirePro's Currency Strength Index, visit http://www.fxwirepro.com/currencyindex.


