


 Global Markets React to Strong U.S. Jobs Data and Rising Yields
  FxWirePro: GBP/NZD gaining momentum for a move towards 2.3350level
  FxWirePro: EUR/AUD bullish outlook with scope to target 1.6500
  AUDJPY Breaks Key Trendline Support — Bears Eye 110 as Momentum Accelerates
  Wall Street Analysts Weigh in on Latest NFP Data
  FxWirePro: NZD/USD downside pressure builds, key support level in focus
  European Stocks Rally on Chinese Growth and Mining Merger Speculation
  Bitcoin Sheds $491M in ETF Outflows and Retreats Below $64K; Sellers Reload for $50K
  Geopolitical Shocks That Could Reshape Financial Markets in 2025
  US Gas Market Poised for Supercycle: Bernstein Analysts
  NZDJPY: The Kiwi Yen's Bull Run Hits a Brick Wall at 92 — Sell the Rally?
  Bank of America Posts Strong Q4 2024 Results, Shares Rise
  S&P 500 Relies on Tech for Growth in Q4 2024, Says Barclays
  2025 Market Outlook: Key January Events to Watch
  EURJPY Bounce Loses Steam Below 184 — Sell-the-Rally Setup Eyes 183 Target
  FxWirePro: USD/JPY edges higher as the yen remains vulnerable despite repeated warnings of intervention.
  U.S. Banks Report Strong Q4 Profits Amid Investment Banking Surge


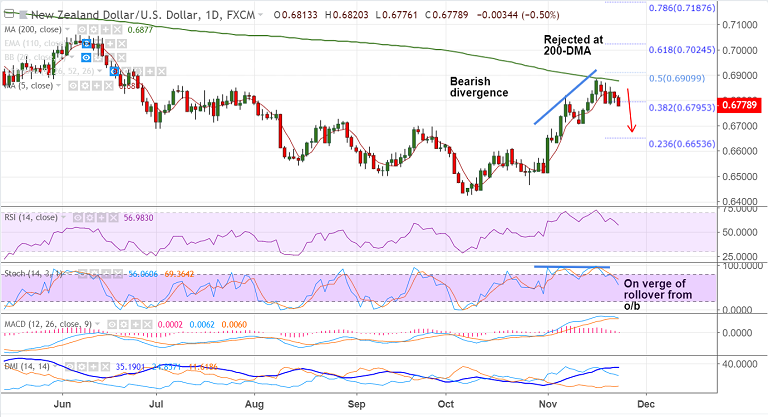
NZD/USD chart on Trading View used for analysis
- NZD/USD slumps lower on broad-based kiwi weakness. Oil weakness weighing on the antipodeans.
- The major is trading 0.49% lower on the day at 0.6779 at the time of writing.
- Price action was rejected at 200-DMA and any bullish continuation only on break above.
- The pair is on track to test 110-EMA at 0.6716. Break below to see further weakness.
- New Zealand quarterly Retail Sales data due for release early Monday session will be in focus for further impetus.
Support levels - 0.6716 (110-EMA), 0.67, 0.6676 (55-EMA)
Resistance levels - 0.6810 (5-DMA), 0.6877 (200-DMA), 0.69
For details on FxWirePro's Currency Strength Index, visit http://www.fxwirepro.com/currencyindex.


