


 FxWirePro: GBP/NZD remains weak, eyes 38.2%fib support
  FxWirePro: GBP/NZD remains weak, eyes 38.2%fib support
  FxWirePro: GBP/USD rises as soft US data pressures dollar
  NZDJPY Retreats on Yen Strength – Bearish Setup Targets 90 After Hitting 92.75 Low
  FxWirePro: GBP/AUD bears maintain upper hand
  AUDJPY Volatile After Massive Sell-Off: Sell Rallies at 113, Targeting 110 as Bearish Momentum Surges
  FxWirePro- Major Pair levels and bias summary
  FxWirePro: USD/CNY dips to hit three year low,scope for further downside
  FxWirePro: USD/ZAR gains as stronger dollar outweighs upbeat South Africa's trade surplus
  FxWirePro: USD/CNY downtrend loses steam, remains on bearish path
  JPY Currency Meter Signals: NZDJPY Bullish (+25) vs CHFJPY (-100) – These Pairs Could Move Next
  FxWirePro: GBP/AUD drifts lower after BOE rate decision
  FxWirePro: NZD/USD consolidates overnight gains, but loses momentum
  FxWirePro: AUD/USD cedes early gains ,outlook bearish
  FxWirePro: USD/CAD retreats after Canada posts stronger-than-expected GDP growth


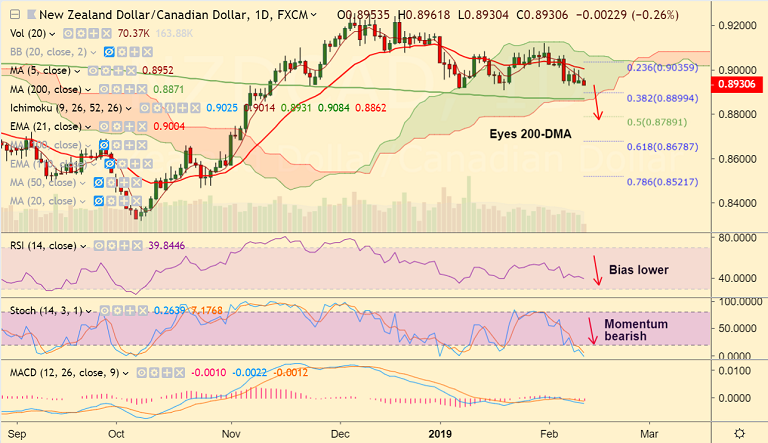
NZD/CAD chart on Trading View used for analysis
- NZD/CAD extends sideways grind along major support at 110-EMA.
- The pair has been capped below 55-EMA and 5-DMA is sharply inclined north which supports further downside.
- Momentum indicators also support downside in the pair. RSI and Stochs are sharply lower.
- Break below 110-EMA will see dip till 200-DMA at 0.8871. Violation at 200-DMA could see further weakness.
- Upside remains capped at 55-EMA, break above could see upside till 23.6% Fib.
Support levels - 0.8899 (38.2% Fib), 0.8871 (200-DMA), 0.8789 (50% Fib)
Resistance levels - 0.8997 (55-EMA), 0.9030 (23.6% Fib), 0.9119 (Jan 31 high)
Recommendation: Stay short on break below 110-EMA, SL: 0.90, TP: 0.89/ 0.8870/ 0.8790
For details on FxWirePro's Currency Strength Index, visit http://www.fxwirepro.com/currencyindex.


