


 FxWirePro: AUD/USD cedes early gains ,outlook bearish
  FxWirePro: GBP/NZD remains weak, eyes 38.2%fib support
  Lithium Market Poised for Recovery Amid Supply Cuts and Rising Demand
  FxWirePro- Woodies pivot (Major)
  Major European Indices Score Extremely Bullish: DAX Eyes 26000, CAC Targets 8600, FTSE100 at 11000 – Key Levels to Watch
  U.S. Treasury Yields Expected to Decline Amid Cooling Economic Pressures
  Gold Prices Fall Amid Rate Jitters; Copper Steady as China Stimulus Eyed
  China's Refining Industry Faces Major Shakeup Amid Challenges
  2025 Market Outlook: Key January Events to Watch
  US Magnificent 7 Stocks Trend Score: Amazon & Microsoft Hit Extreme Bullish (+100) as Meta Drops to -100 — Key Resistance & Support Watchlist
  Global Markets React to Strong U.S. Jobs Data and Rising Yields
  FxWirePro- Major Pair levels and bias summary
  All Major JPY Pairs Hit Extreme Bearish Score of -100: USDJPY, EURJPY, GBPJPY, AUDJPY, NZDJPY & CADJPY Flash Maximum Weakness
  FxWirePro: USD/ZAR gains as stronger dollar outweighs upbeat South Africa's trade surplus
  Geopolitical Shocks That Could Reshape Financial Markets in 2025
  Urban studies: Doing research when every city is different


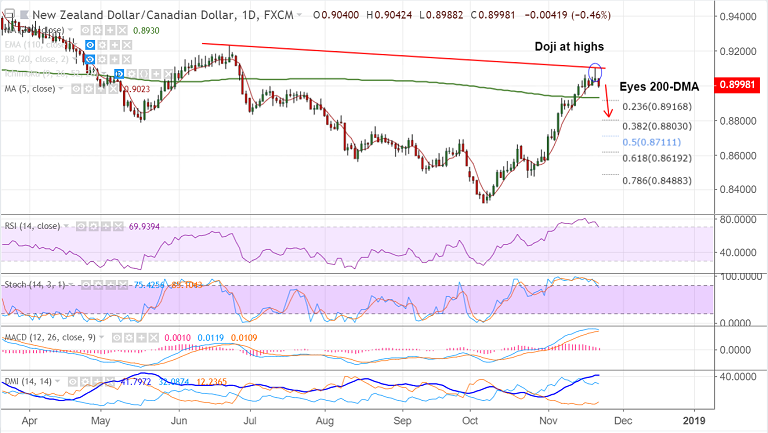
NZD/CAD chart on Trading View used for analysis
- NZD/CAD trades 0.45% lower at the time of writing, at 0.8999 levels.
- The pair is extending weakness with 'Gravestone Doji' formation at highs on Wednesday's trade.
- Kiwi sell-off across the board is knocking the pair lower.
- We also find that the momentum indicators on daily charts are at overbought levels.
- Some unwinding likely. Pair eyes 200-DMA at 0.8930. Breach there could see dip till 20-DMA at 0.8844.
- Major trend remains bullish. Failure to break below 200-DMA will see resumption of upside.
Support levels - 0.8930 (200-DMA), 0.8844 (20-DMA), 0.8816 (23.6% Fib)
Resistance levels - 0.9024 (5-DMA), 0.91 (Nov 21 high)
Recommendation: Good to go short on upticks, SL: 1.9030, TP: 0.8930/ 0.89/ 0.8844
For details on FxWirePro's Currency Strength Index, visit http://www.fxwirepro.com/currencyindex.


