


 UBS Projects Mixed Market Outlook for 2025 Amid Trump Policy Uncertainty
  AUDJPY Breaks Key Trendline Support — Bears Eye 110 as Momentum Accelerates
  Goldman Predicts 50% Odds of 10% U.S. Tariff on Copper by Q1 Close
  NZDJPY Bears Reload as 92 Resistance Caps Bounce; Sell-on-Rallies Eyed Toward 90
  AUDJPY Bears Take a Breather at 111.50, But ‘Sell on Rallies’ Still Eyes 110
  FxWirePro: AUD/USD drifts lower, uninspired by jobs beat
  Geopolitical Shocks That Could Reshape Financial Markets in 2025
  Fed May Resume Rate Hikes: BofA Analysts Outline Key Scenarios
  Global Markets React to Strong U.S. Jobs Data and Rising Yields
  U.S. Stocks vs. Bonds: Are Diverging Valuations Signaling a Shift?
  FxWirePro: GBP/AUD sustains gains as uptrend remains strong
  FxWirePro- Major Crypto levels and bias summary
  U.S. Banks Report Strong Q4 Profits Amid Investment Banking Surge
  Energy Sector Outlook 2025: AI's Role and Market Dynamics
  US Gas Market Poised for Supercycle: Bernstein Analysts
  FxWirePro: AUD/USD eases after Australian mixed CPI data


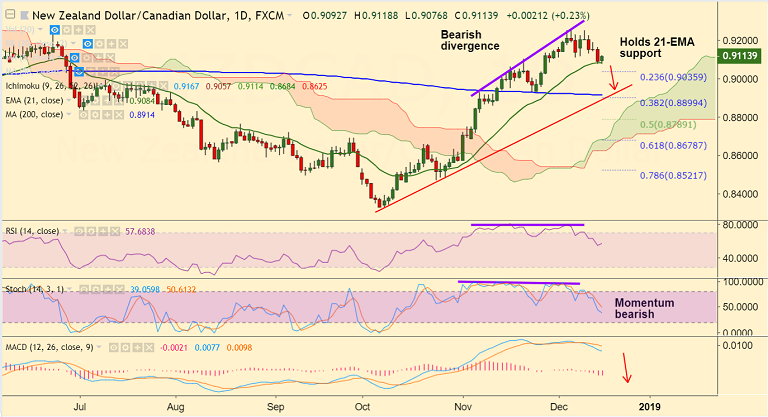
NZD/CAD chart on Trading View used for analysis
- NZD/CAD is trading 0.29% higher on the day at 0.9117 at the time of writing.
- The pair finds strong support at 21-EMA at 0.9086, break below will see weakness.
- Technical studies support downside. Stochs and RSI are biased lower.
- We evidence bearish divergence on RSI and Stochs which adds to the bearish bias.
- New Zealand Q3 GDP figures (due Wed) will drive price action if there is any significant surprise. Markets expect Q3 GDP to edge lower to 0.6% from 1.0% in the previous quarter.
- Focus also on Bank of Canada's (BoC) Consumer Price Index due Wednesday for further direction.
- Immediate support below 21-EMA lies at 23.6% Fib at 0.9035. Further weakness will see test of 200-DMA at 0.8914.
- 5-DMA at 0.9143 is immediate resistance. Decisive break above could see further upside.
Support levels - 0.9084 (21-EMA), 0.9035 (23.6% Fib), 0.90, 0.8914 (200-DMA)
Resistance levels - 0.9143 (5-DMA), 0.92, 0.9251 (Dec 11 high)
Recommendation: Watchout for break below 21-EMA to go short, target 200-DMA at 0.8914.
For details on FxWirePro's Currency Strength Index, visit http://www.fxwirepro.com/currencyindex.


