


 US Gas Market Poised for Supercycle: Bernstein Analysts
  FxWirePro: GBP/AUD sustains gains as uptrend remains strong
  FxWirePro: USD/ZAR remains buoyant, looks to extend gains
  FxWirePro: USD/CNY hits one –month high, scope for further upside
  UBS Predicts Potential Fed Rate Cut Amid Strong US Economic Data
  China’s Growth Faces Structural Challenges Amid Doubts Over Data
  2025 Market Outlook: Key January Events to Watch
  Moody's Upgrades Argentina's Credit Rating Amid Economic Reforms
  Gold Prices Slide as Rate Cut Prospects Diminish; Copper Gains on China Stimulus Hopes
  BTC Slips Below $60K as Institutional Demand Dries Up — Bears Eye $59K Support, Rallies to $63K for Shorts
  US Futures Rise as Investors Eye Earnings, Inflation Data, and Wildfire Impacts
  Trump’s "Shock and Awe" Agenda: Executive Orders from Day One
  Geopolitical Shocks That Could Reshape Financial Markets in 2025
  FxWirePro: NZD/USD downside pressure builds, key support level in focus
  Stock Futures Dip as Investors Await Key Payrolls Data
  FxWirePro: AUD/USD drifts lower, uninspired by jobs beat


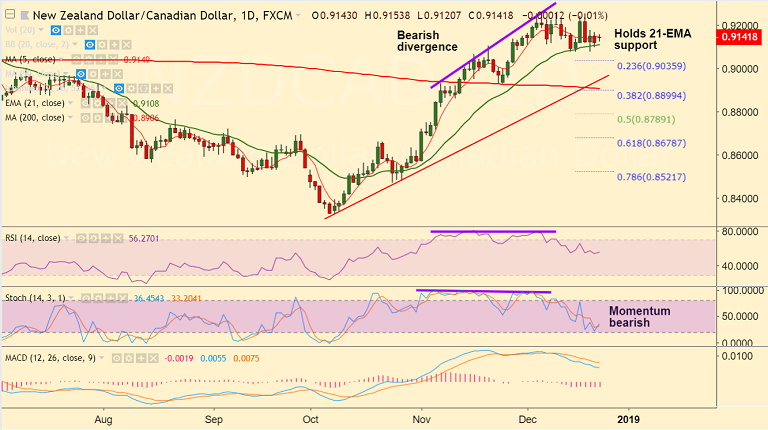
NZD/CAD chart on Trading View used for analysis
- NZD/CAD trades rangebound on the day at 0.9144 at the time of writing.
- The pair is extending sideways grind at strong support at 21-EMA. Break below will see further weakness.
- Technical indicators are biased lower for the day and bearish divergence on RSI and Stochs keeps scope for weakness.
- Break below 21-EMA to see dip till 23.6% Fib at 0.9035. Further weakness will see test of 200-DMA at 0.89.
- Indicators are slowly turning, decisive close above 5-DMA could see resumption of upside. Scope then for test of 0.9250 (Dec 19 high)
Support levels - 0.91 (21-EMA), 0.9035 (23.6% Fib), 0.89 (200-DMA)
Resistance levels - 0.9150 (5-DMA), 0.92, 0.9238 (Upper BB), 0.9250 (Dec 19 high)
For details on FxWirePro's Currency Strength Index, visit http://www.fxwirepro.com/currencyindex.


