


 FxWirePro: GBP/AUD under pressure as the pair continues to weaken
  FxWirePro: NZD/USD turns lower as USD regains footing
  FxWirePro:EUR/NZD downtrend Intact, eyes 1.9500 level
  FxWirePro: USD/ZAR faces downside pressure with 38.2%fib support in focus
  FxWirePro- Major Pair levels and bias summary
  FxWirePro: USD/CNY edges higher, outlook bearish
  Gold Retreats as Geopolitical Fears Ease: Bears Target $4,000 Support
  NZDJPY Bears Stay in Control After Sell-Off — Sell Rallies at 93 Targeting 90 as All EMAs Align Bearish
  FxWirePro: GBP/AUD consolidating around 1.9185, bias is bearish
  FxWirePro : EUR/NZD outlook weaker on renewed downside pressure
  FxWirePro: USD/JPY gains capped as intervention fears keep traders on edge
  FxWirePro: GBP/USD slips as dollar rebounds from six-week low
  FxWirePro- Major Crypto levels and bias summary
  EUR/USD Retraces After 1.1555 Peak: Technical Levels Point to 1.1600
  FxWirePro- Woodies pivot (Major)


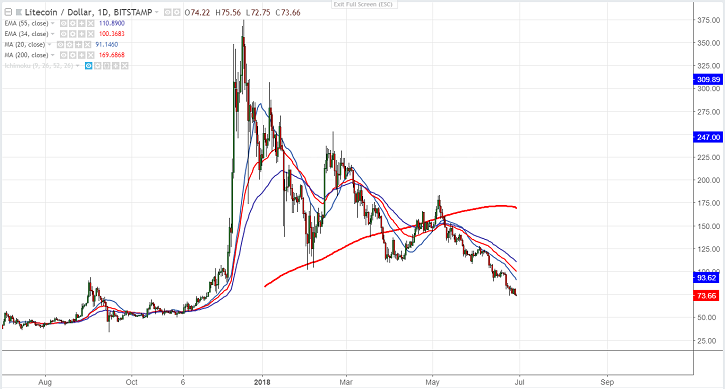
- LTC/USD has shown a minor decline and is trading near 2018 low after showing a minor jump till $84.50. The pair declined more than 50% from the temporary top $182.35. It is currently trading around $73.66.It has declined almost 79% from the all-time high of $370.
- The near term solid resistance is around $93 (20 day MA) and any break above will take the pair to next level till $102 (34- day EMA) /$112.26 (55- day EMA).
- On the lower side, any break below $73 confirms minor weakness and a decline till $70/$60 is possible.
It is good to sell on rallies around $80-82 with SL around $105 for the TP of $75/$70.







