


 Today’s space race could turn fatal if we don’t agree on new rules
  U.S. Banks Report Strong Q4 Profits Amid Investment Banking Surge
  US Gas Market Poised for Supercycle: Bernstein Analysts
  Gold Prices Slide as Rate Cut Prospects Diminish; Copper Gains on China Stimulus Hopes
  How Donald Trump has changed the way diplomacy is done
  U.S. Treasury Yields Expected to Decline Amid Cooling Economic Pressures
  Geopolitical Shocks That Could Reshape Financial Markets in 2025
  Goldman Sachs: US Dollar Likely to Stay Strong Despite Oil Price Retreat
  Gold's 365-Day EMA Streak Since Oct 2023 Faces Its First Real Test at $3,980 — Break or Bounce to $4,140?
  Wall Street Analysts Weigh in on Latest NFP Data
  S&P 500 Relies on Tech for Growth in Q4 2024, Says Barclays
  How AI prompting turned writerly description into an everyday skill


The Black–Scholes model has been accredited as a vivid breakthrough in asset pricing theory. But in applying it to real world options, problems immediately arose, because the volatility that makes an option’s model value consistent with its market price is different for different strike prices: thewell-knownn “volatility smile.” Over time, the smile evolved into a more monotonic, downward-sloping “skew,” and traders became comfortable with the idea of modeling its behavior and describing option market conditions in terms of the level and skew of implied volatilities.
A standard explanation for the skew is that the return distribution is not lognormal; in particular, it generally has a negative third moment (i.e., negative skewness). The similarity of the terms and the (potential) connection between the volatility skew and statistical skewness is one source of confusion. Another is that (unlike skewness) there is no standard measure for the volatility skew.
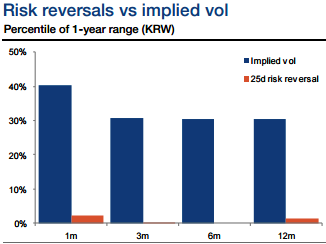
The skewness appears to be very depressed in KRW despite the elevated implied volatilities.
The KRW implied vol (1m to 1y) is in the middle of the 1-year range whereas 25-delta risk reversals are at the very bottom end.
The difference is even more marked in MXN, where implied volatility is at the top end of the 1-year range but risk reversals are close to the low point across the 3m-12m tenors.
As such, risk reversals could be a cheaper way to own volatility or position for tail risks compared to dollar calls.
However, for both MXN and KRW the beta of skew to moves in spot has fallen dramatically in recent years and in the case of MXN has plunged into negative territory.
It is explored that these issues and reviews a number of common skew measures. One significant result is that most of them vary strongly with the level of volatility, making comparisons across different underlying assets or over time difficult. After examining several performance measures, it is suggested that the most useful measure of the volatility skew is the difference between the implied volatilities for a 25 delta put and a 25 delta call, divided by the implied volatility for a 50 delta option.


