


 UBS Projects Mixed Market Outlook for 2025 Amid Trump Policy Uncertainty
  US Gas Market Poised for Supercycle: Bernstein Analysts
  Trump’s Iran Strategy: What Has Been Achieved After Three Months of Conflict?
  Sell the Bounce": Gold Rally Stalls Near $4165 as Fed Hawks Slam the Door on Rate Cuts — Targets $4000/$3600
  S&P 500 Relies on Tech for Growth in Q4 2024, Says Barclays
  U.S. Stocks vs. Bonds: Are Diverging Valuations Signaling a Shift?
  Oil Prices Dip Slightly Amid Focus on Russian Sanctions and U.S. Inflation Data
  Goldman Predicts 50% Odds of 10% U.S. Tariff on Copper by Q1 Close
  Mexico's Undervalued Equity Market Offers Long-Term Investment Potential


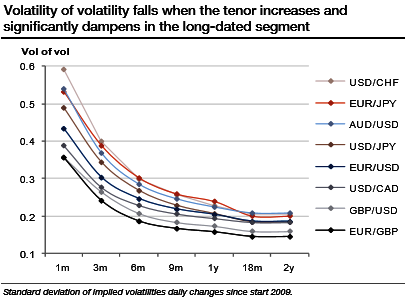
According to market spreads, the eight most liquid currencies pairs (in decreasing order) are EUR/USD, USD/JPY, EUR/JPY, GBP/USD, EUR/GBP, AUD/USD, USD/CAD, and USD/CHF. The following illustrations are restricted to this universe.
The volatility of volatility of our eight pairs is represented on Graph for tenors from 1m to 2y. For each pair, we observe the suspected decreasing relationship between the tenor and the instability of the implied volatility. Since 2009, GBP volatilities have been the more stable, while the most volatile have been JPY and AUD/USD volatilities.
USD/CHF volatility emerges as one of the most unstable, but this is entirely due to the SNB FX interventions and policy shifts that triggered several volatility bursts, strongly distorting historical data.
We spot out the massive drops in 1w-3m IVs, 13.2% in 1w expiries and 9% in 3m tenors, while risk reversals favour bulls in Swiss franc for which SNB is unhappy with.
The majority of central banks are happy with conventional measures such as that, but not the SNB. During the Brexit night, the Swiss National Bank intervened.
After all, everyone is meant to realise that the Swiss central bank will not tolerate an excessive appreciation of the franc. And after all, that is not exactly a new feature of Swiss monetary policy.
Since the minimum exchange rate in EURCHF was abolished interventions have become part of the SNB’s everyday repertoire.
From the return to volatility change: A standard asset in a portfolio delivers a return and investing in volatility as an asset class should not deviate from this principle. The equivalent of standard returns is the implied volatility change expressed in points. Unlike a return where we are only interested in positive values, a volatility seller will look for a negative change making it necessary to distinguish between buying and selling volatility.


