


 UBS Predicts Potential Fed Rate Cut Amid Strong US Economic Data
  Oil Prices Dip Slightly Amid Focus on Russian Sanctions and U.S. Inflation Data
  Indonesia Surprises Markets with Interest Rate Cut Amid Currency Pressure
  S&P 500 Relies on Tech for Growth in Q4 2024, Says Barclays
  European Stocks Rally on Chinese Growth and Mining Merger Speculation
  Urban studies: Doing research when every city is different
  Global Markets React to Strong U.S. Jobs Data and Rising Yields
  Trump’s Iran Strategy: What Has Been Achieved After Three Months of Conflict?
  AI Memory Boom Sparks Global Chip Supply Crunch
  2025 Market Outlook: Key January Events to Watch
  Trump’s "Shock and Awe" Agenda: Executive Orders from Day One
  U.S. Treasury Yields Expected to Decline Amid Cooling Economic Pressures
  Lithium Market Poised for Recovery Amid Supply Cuts and Rising Demand
  Mexico's Undervalued Equity Market Offers Long-Term Investment Potential


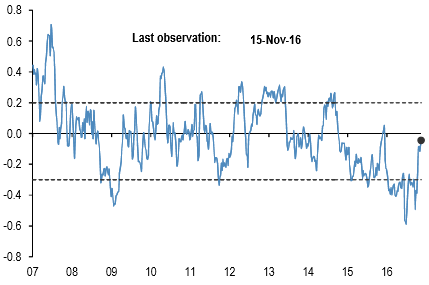
The difference between net spec positions on risky & safe currencies
Net spec position is calculated in USD across 5 "risky" and 3 "safe" currencies (safe currencies also include Gold).
These positions are then scaled by open interest and we take an average of "risky" and "safe" assets to create two series.
The above chart is then the simply the difference between the "risky" and "safe" series. The final series shown in the chart is demeaned using data since 2006. The risky currencies are: AUD, NZD, CAD, RUB, MXN, and BRL. The safe currencies are: JPY, CHF, and Gold.
You could probably understand why we are stating this by referring the above nutshell evidencing delta risk reversal. JPY, CHF and XAU crosses against the dollar have negative flashes which would mean that these currencies have safe proportions in hedging arrangements, whereas rest dollar crosses show positive risk reversal which means that bearish pressures are intensifying in these counterparts of the dollar.
Net spec positions are the number of long contracts minus the number of short using CFTC futures only data. This net position is then converted to a USD amount by multiplying by the contract size and then the corresponding futures price.
To proxy for speculative investors, for commodity positions we use the managed money category, for equity positions we use Leveraged funds and Asset managers, whereas other assets use the legacy non-commercial category.
We then scale the net positions by open interest. The chart shows the z-score of these net positions, i.e. the current net position divided by the open interest, minus the average over the whole sample divided by the standard deviation of the weekly positions over the whole sample.
US rate is a duration-weighted composite of the individual UST series excluding the Eurodollar contract. UK ICE Brent positions are with one week lag. The sample starts on the 13th of June 2006.


