


 NZDJPY Poised for Downtrend as Resistance Holds Firm
  FxWirePro: GBP/NZD pulls back slightly , bullish bias persists.
  FxWirePro- Woodies pivot (Major)
  FxWirePro: USD/CNY extends drop, faces 23.6%fib support
  USDCHF Faces Downside Risk as Resistance Holds; Sell Rallies Recommended
  NZDJPY Pullback: Bearish Trend Favors Sellers Below 92.50 Resistance
  FxWirePro: NZD/USD advances as weak U.S. payrolls pressure greenback
  FxWirePro: USD/ZAR downside pressure builds, key support level in focus
  EURJPY Plunges Below 184 Amidst Yen Strength: Bearish Outlook Persists
  FxWirePro USD/JPY dips as Yen gains after Japan reaffirms FX intervention readiness
  BTCUSD Recovers Amid Easing Tensions, But Resistance Looms
  FxWirePro- Major Crypto levels and bias summary
  Gold Surges Above $4100 on Weak US Jobs Data; Bullish Momentum Builds
  FxWirePro: USD/ZAR slips as weak U.S. Jobs data weighs on dollar
  FxWirePro: EUR/USD edges higher but rally stalls below post-NFP peak
  FxWirePro- Major Pair levels and bias summary
  FxWirePro: USD/CAD slips on softer US payrolls but near-term direction hinges on 1.4154 support


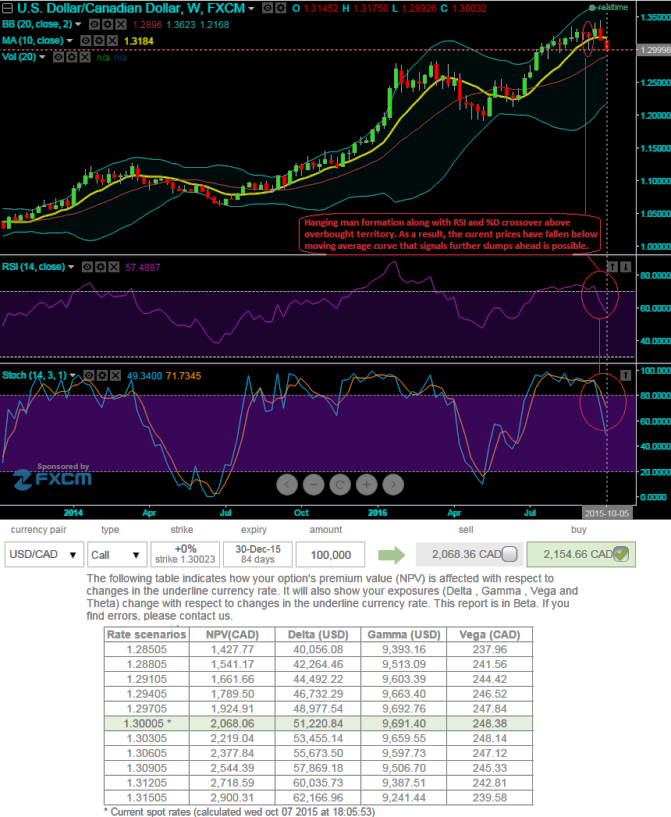
We could foresee the bulls taking halt at this point, this has been confirmed with a hanging man candle formation on weekly chart at 1.3219. Hanging man at peaks of the uptrend is a bearish signal but there has to be further substantiation from leading oscillators which we saw from RSI and stochastic reached overbought zones and there has been divergence to the rising prices.
%D crossover above 80 levels which is overbought territory alerts short term bulls to cover their positions as fresh short build ups are on the cards in short run. Moreover, the current weekly prices have fallen below moving average curve that signifies the existing bearish pressures may extend until Fed's season. During that season anytime dollar strength can be foreseen.
So for now sell near month out of the money call and buy back far month ATM call. The diagonal bull call spread involves buying long term calls and simultaneously writing an equal number of near-month calls.
This strategy is typically employed when the options trader or hedger is bullish on the underlying pair over the longer term but is neutral to mildly bearish in the near term. It may even be possible at some point in time to own the long term call "for free".
Usage of ATM instruments because we think shift in vega has been quite justifiable with corresponding increase in exchange rate while volatility is perceived to be at 8% which is quite neutral side. Shift in Vega on long ATM call is from 248.38 to 239.58 when the pair starts picking up and reaches up to 1.3154 levels.

- News

- Economy

- Central Banks
- Investing
- Research
- Roundups
- Digital Currency
- Insights
- Technical Analysis
- Technology
- Business
- Law
- Health
- Nature
- Fintech
- Science
- Topic
- Opinions
- ©Econometrics LLC . All Rights Reserved.
FxWirePro: Hanging man & leading oscillators signal exhausted USD/CAD uptrend – Diagonal bull spreads for hedging
Wednesday, October 7, 2015 12:46 PM UTC
Editor's Picks


- Market Data
Most Popular


