


 FxWirePro: GBP/AUD drifts lower after BOE rate decision
  FxWirePro: USD/ZAR gains as stronger dollar outweighs upbeat South Africa's trade surplus
  NZDJPY Bullish Rebound: Buy Dips as EMAs Align for 97 Target
  US Magnificent 7 Stocks Trend Score: Amazon & Microsoft Hit Extreme Bullish (+100) as Meta Drops to -100 — Key Resistance & Support Watchlist
  FxWirePro- Major Crypto levels and bias summary
  FxWirePro: GBP/NZD remains weak, eyes 38.2%fib support
  AUD/JPY Slips Below 112 as BOJ Intervention Sparks Bearish Momentum: Sell the Rallies
  AUDJPY Volatile After Massive Sell-Off: Sell Rallies at 113, Targeting 110 as Bearish Momentum Surges
  FxWirePro: EUR/ AUD dips below 1.6400 level, focus on near term support
  FxWirePro: GBP/AUD bears maintain upper hand
  FxWirePro- Major Pair levels and bias summary
  FxWirePro- Major Pair levels and bias summary
  FxWirePro: NZD/USD consolidates overnight gains, but loses momentum
  FxWirePro- Woodies pivot (Major)
  FxWirePro- Major Crypto levels and bias summary
  NZDJPY Retreats on Yen Strength – Bearish Setup Targets 90 After Hitting 92.75 Low


Gold declined sharply till $1274 after release of US GDP data and shown a massive recovery. US GDP came at 3.2% seasonally adjusted annual rate in the first three months of 2019 well above forecast of 2.0%.The yellow metal has lost more than $80 from high of $1341 made on Feb 20th 2019 on account of strong global markets and easing US-Sino trade tensions.
US dollar Index: Bearish. DXY has shown a decline of nearly 50 pips after hitting high of 98.33. Minor trend is slightly weak and a decline till 97.31 is possible .Any break below 97.31 (20 day MA) confirms further weakness and a decline till 96.85 likely.It is currently trading around 97.97. (positive for gold).
USD/JPY: weak . USD/JPY is struggling to close above 112 after hitting high of 112.40 level.The near term support is 111.50 (200- day MA) and any violation below will drag the pair to net level till 111.Positve for gold.
US 10 year yield : US 10 year yield lost more than 4.5% from high of 2.615%.In short term yield has jumped more than 11% from 14-month low of 2.34%. Overall it has been trading weak for past four months and lost nearly 25% from high of 3.25%.It is currently trading around 2.536%. Slightly positive for Gold.
US 2 year yield: It is trading around 2.29%. The spread between US 10 year and 2 year has declined to 20bpbs from 30 basis point. The spread between 3 month and 10- year yield inversion has reversed (US 10 year yield trading above US 3 month).
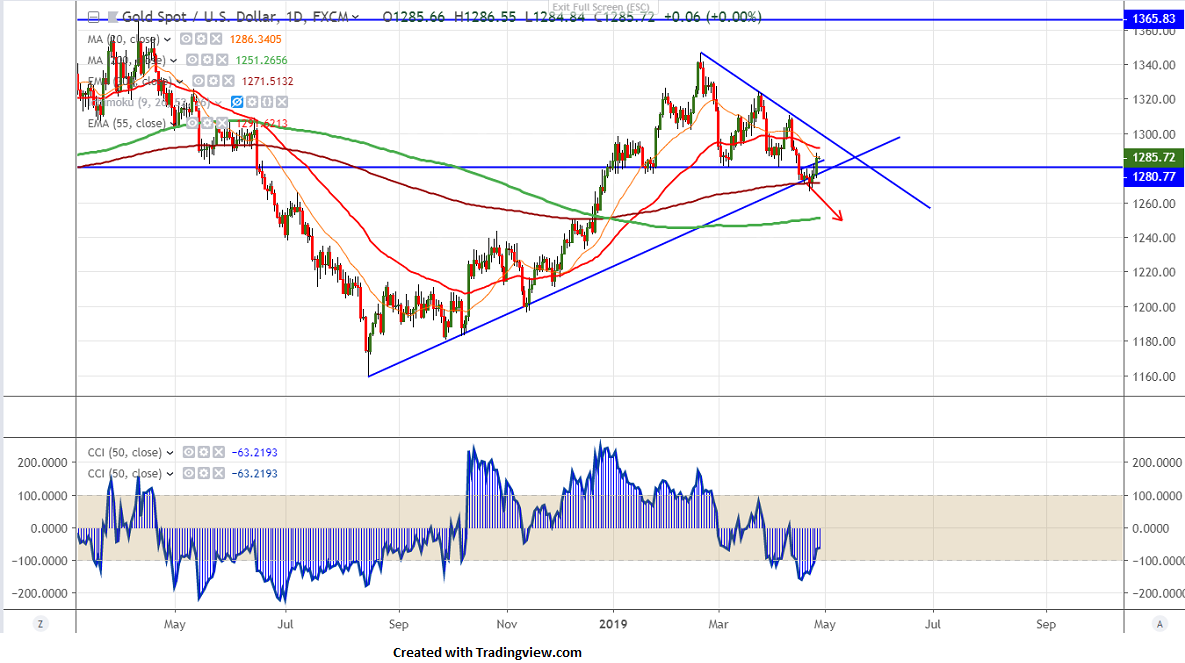
Gold technical
On the higher side, near term resistance is around $1292 (55- day EMA) and any convincing break above targets $1296/$1300. The yellow metal should break above $1300 for further bullishness.
The near term support is around $1280 and any break below will drag the commodity down till $1274/$1270. Any bearish continuation only below $1266.
It is good to buy on dips around $1280-81 with SL around $1274 for the TP of $1300.


