


 BOJ Signals Faster Rate Hikes as Inflation Risks Grow
  Stock Futures Dip as Investors Await Key Payrolls Data
  Goldman Predicts 50% Odds of 10% U.S. Tariff on Copper by Q1 Close
  Fed's Hammack Urges Faster Rate Hikes to Fight Inflation
  FxWirePro- Major Pair levels and bias summary
  Urban studies: Doing research when every city is different
  European Stocks Rally on Chinese Growth and Mining Merger Speculation
  FxWirePro: USD/CAD edges higher, retains bid tone
  Wall Street Analysts Weigh in on Latest NFP Data
  ECB-BoE Policy Divergence Drags
EURGBP trades weak for the third consecutive week
ECB-BoE Policy Divergence Drags
EURGBP trades weak for the third consecutive week  FxWirePro: USD/ZAR uptrend loses steam, remains on bullish path
  Philippines Current Account Deficit Seen at $19.1 Billion in 2026
  AUDJPY Coils in Tight Range: Bulls Eye Dips as 110 Support Sets the Stage for Breakout
  FxWirePro- Major Pair levels and bias summary


 Add as a preferred source on Google
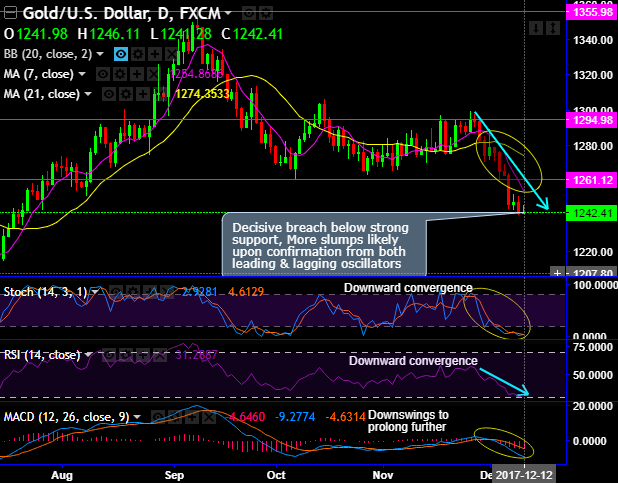
Chart and candlestick pattern formed: 50% Fibonacci retracements from the peaks of $1357.47 (refer weekly plotting).
The decisive breach below strong support at $1261.12, that’s where a stern bearish candle pops up with a big real body (refer daily chart).
Momentum study: Both RSI and stochastic curves converge downwards to signal the intensified bearish momentum.
Trend study: On time frames, both lagging indicators (bearish DMA, EMA & MACD crossovers) indicate the downtrend continuation in the days to come.
Well, for now, more slumps seem to be likely upon confirmation from both leading & lagging oscillators.
Meanwhile, Fed is scheduled to announce funds rates decision tomorrow, and we’ve already stated in our previous post that the Federal Reserve is no longer expected to pause the rate hike cycle early next year for two main reasons. Primarily, the nomination of Governor Powell as the next Fed chair, in our view, represents a vote for continuity of policy. Secondarily, the unemployment rate is falling again. At 4.1 percent, the risk of a substantial undershoot is rising, Barclays Research reported.
Accordingly, we advocate short hedges in yellow metal on waning safe-haven sentiments as Fed hiking season looms.
Gold prices have tumbled from the highs of peaks of 1299.10 to the recent lows 1240.70 levels or 4.49% in just three weeks.
As the further bearish risks are foreseen, hedge via shorting CME Gold futures of Jan’17 delivery as the yellow metal hit its least since 24th July at $1,243.56 on Tuesday on waning sentiments of demand for safe-haven assets.
We have already labeled our bias to enter short trade recommendations in gold and silver but decided to hold off given the looming monetary policy seasons (metals weekly gold and silver bulls received some sort of gift-wrapped headlines last week but higher US rates would eventually spoil the party).
For today, gold prices edged higher in European trading session but held near their lowest level in around fifth month amid growing expectations for two more hikes in the U.S. interest rate next year. The metal is highly sensitive to rising U.S. interest rates.
The price forecasts of gold for next 1m is at $1,225/oz. This is bearish, as the 6m forward curve is at $1,295/oz. If the most extreme upside price risk prevails, we could see prices maximum $1,325/oz. If our most extreme downside risk prevails, we could see prices average $1,175/oz.
Our 12m forecast for gold is $1,175/oz. This is a very bearish outlook, as the 12m forward curve is at $1,312/oz. We expect prices to fluctuate between $1,175/oz and $1,350/oz over the next 6–12 months.







