


 China’s AI Manufacturing Boom Masks Weak Consumer Economy, Citi Says
  SpaceX Stock Gets $175 Target as Analysts See Massive Growth Ahead
  With Iran and the US signing a peace deal, where does that leave Benjamin Netanyahu?
  Trump’s Iran Strategy: What Has Been Achieved After Three Months of Conflict?
  AI Memory Boom Sparks Global Chip Supply Crunch
  Bank Regulation Rollbacks in the U.S. and UK Could Increase Financial Risks, Study Warns
  Goldman Sachs: US Dollar Likely to Stay Strong Despite Oil Price Retreat
  J.P. Morgan Sees Potential Vestas Guidance Upgrade Amid Strong Wind Energy Demand
  Sell the Bounce": Gold Rally Stalls Near $4165 as Fed Hawks Slam the Door on Rate Cuts — Targets $4000/$3600
  Gold's 365-Day EMA Streak Since Oct 2023 Faces Its First Real Test at $3,980 — Break or Bounce to $4,140?
  World Cup technology: from ref cams to AI analysts, cutting-edge research is changing the game
  How Donald Trump has changed the way diplomacy is done


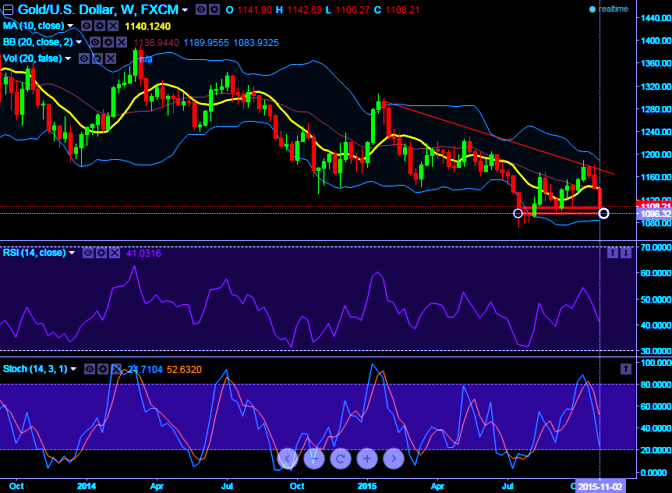
The precious metal has surpassed all major price levels where supply was seen more than demand and for now likely to find support at $1,105.20 levels, if it does not mange to hold these levels then 1096 areas cannot be disregarded.
The precious metal has been tumbling consecutively from last couple of weeks but as stated in our earlier post we think it should test support at around 1096 levels to bounce back.
This week's closing would be keenly observed, if it manages to hold 1105 and 1096 then sharp bounces are certain, otherwise it's going to be pure gamble for expecting upswings ahead of Fed's monetary season next month.
RSI justifies dipping prices: The pair at this psychological juncture testing supports, while RSI still evidences downward convergence with sharp declines (Currently, trending around 41.3439 while articulating).
Stochastic supports bearish momentum: To substantiate these price slumps, slow stochastic curves view on weekly charts signifies to remain in sync with the standpoint offered by RSI. A perfect %D line crossover exactly at 80 levels which is overbought zone bolsters selling pressures, (Currently, %D line is at 53.0303 and %K at 25.9413 while articulating).
10DMA: As we all know moving average is a lagging indicator, the 10DMA was also suggesting the prevailing price declines to prevail for some more time.
Hence, contemplating all above technical reasoning, it is advisable to short this commodity for targets of 1096 levels with strict stop loss of 1115 levels.

- News

- Economy

- Central Banks
- Investing
- Research
- Roundups
- Digital Currency
- Insights
- Technical Analysis
- Technology
- Business
- Law
- Health
- Nature
- Fintech
- Science
- Topic
- Opinions
- ©Econometrics LLC . All Rights Reserved.
FxWirePro: Gold likely to test crucial supports at 1105 but slips below moving average, leading oscillators confirm more dips
Thursday, November 5, 2015 12:50 PM UTC
Editor's Picks


- Market Data
Most Popular


