


 Ferrari Group to Launch IPO in Amsterdam, Targets Over $1 Billion Valuation
  FxWirePro: USD/JPY edges higher as focus shifts to BOJ decision
  Wall Street Rebounds as Investors Eye Tariff Uncertainty, Jobs Report
  FxWirePro- Major Crypto levels and bias summary
  FxWirePro: GBP/NZD remains weak, eyes 38.2%fib support
  Investors value green labels — but not always for the right reasons
  AUD/JPY Slips Below 112 as BOJ Intervention Sparks Bearish Momentum: Sell the Rallies
  U.S. Banks Report Strong Q4 Profits Amid Investment Banking Surge
  FxWirePro : GBP/NZD strongly bearish despite upside attempts
  SoftBank Eyes Up to $25B OpenAI Investment Amid AI Boom
  Nikkei Surges Past 65,000 on Suspected Yen Weakness: Tech Giants Like Advantest and NEC Lead Explosive Gains
  Apple Downgraded by Jefferies Amid Weak iPhone Sales and AI Concerns
  FxWirePro:EUR/NZD gains some upside momentum but still bearish
  Tempus AI Stock Soars 18% After Pelosi's Investment Disclosure
  Insignia Financial Shares Hit 3-Year High Amid Bain and CC Capital Bidding War


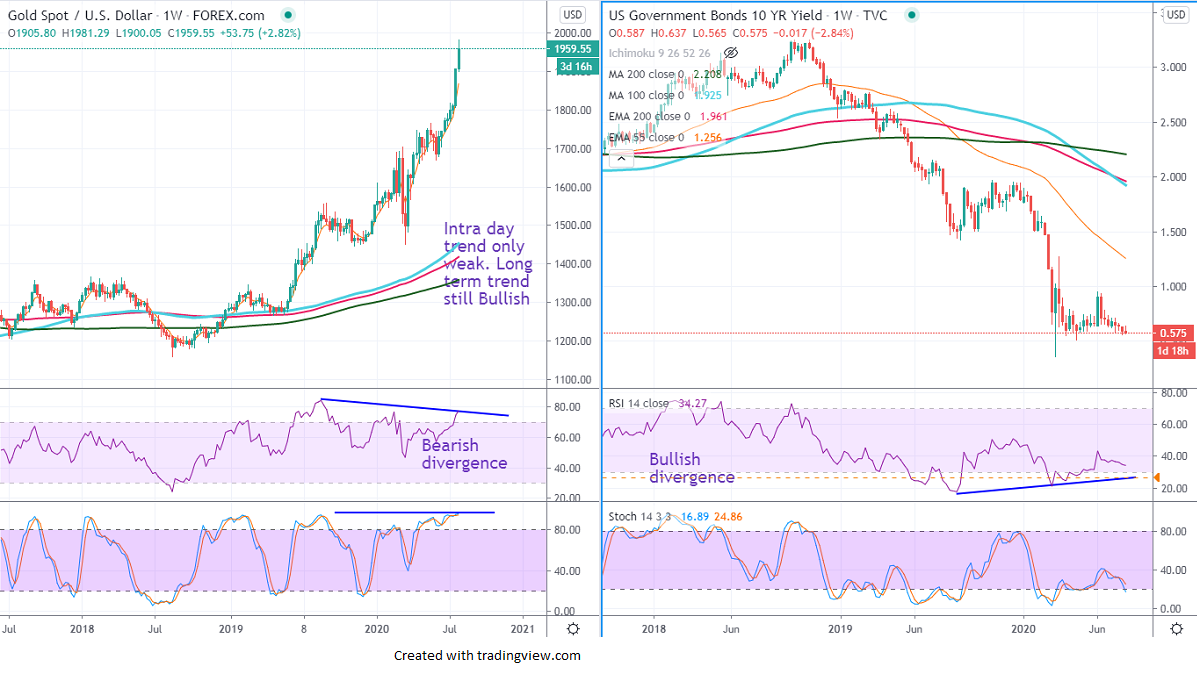
Ichimoku Analysis (Weekly Chart)
Tenken-Sen- $1788
Kijun-Sen- $1678
Gold continuously trading on the higher side for the past four months and jumped more than $500 on safe-haven demand. The dovish Fed has dragged the US dollar index further down and hovering near 2- year low. The pandemic has started in Feb, the number of cases in the world crossed 17.5 million and deaths nearing 6.70 million.
Gold Vs. US yield.
US Bond yield:
The U.S 10 year bond yield lost more than 40% from the minor top 0.95% made on un 2020. It has inched lower to around 0.573% at the time of writing. The dovish Fed might drag the yield further down till 0.36% low made on Mar 9th, 2020. Technically in the Weekly chart, it is facing bullish divergence and minor recovery in yield will be possible. The US 2-year yield trading at a near-record low and spread between US 10- and 3 months narrowed to 0.47%% from 1.81%.
US Dollar Index - bearish and hits 2- year low (positive for yellow metal)
S&P500- bullish (positive for gold)
US Bond yield- weak but oversold (slightly negative for gold)
Technical:
The yellow metal is in the overbought zone and minor profit booking till $1900 is possible. The near term resistance is around $2000, the violation above will take the pair to the next level till $2025/$2040.
The immediate support is around $1930, any indicative break beneath targets $1900/$1859.
It is good to sell on rallies around $1960-63 with SL around $1981 for the TP at $1900.


