


 FxWirePro: EUR/AUD neutral in the near term, scope for downward resumption
  FxWirePro: GBP/AUD bears maintain upper hand
  FxWirePro: GBP/USD downtrend loses steam but outlook still bearish
  FxWirePro: EUR/NZD downside pressure builds, key support level in focus
  NZDJPY Bullish Dip-Buy Setup: 93.60 Support Unlocks Path to 97
  EUR/USD Slides After ECB Hold, Bearish Technicals Favor Rally Fades
  JPY Action Bias: USDJPY, EURJPY, and CADJPY Emerge as Top Extremely Bullish Picks
  BTC, ETH, SOL, XRP, and BNB: Major Crypto Pairs Stay Neutral
  FxWirePro: USD/CNY edges higher but bulls lack punch
  FxWirePro- Major Crypto levels and bias summary
  FxWirePro: USD/CAD positions for another climb, eyes 1.4150 level
  FxWirePro- Major Crypto levels and bias summary
  FxWirePro- Woodies pivot (Major)
  FxWirePro: USD/ZAR retreats slightly but bias is bullish
  Major Pairs Action Bias: USDCHF Emerges Extremely Bullish as EURUSD and GBPUSD Turn Deeply Bearish
  FxWirePro- Major Pair levels and bias summary


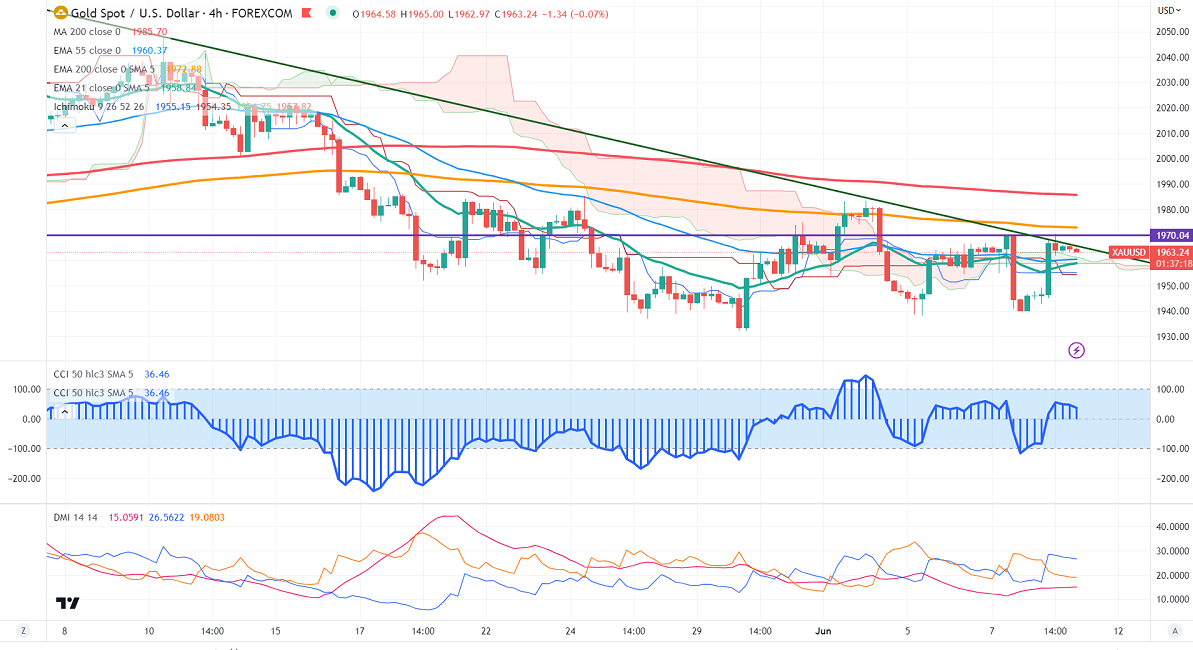
Ichimoku Analysis (4-Hour chart)
Tenken-Sen- $1955.15
Kijun-Sen- $1954.35
Gold prices trading in a narrow range between $1938.40 and $1970.25 for the past four days. The minor sell-off in the US dollar and US treasury yield supports the yellow metal at a lower level. It hits a low of $1970.50 yesterday and is currently trading around $1963.28.
US dollar index- Neutral. Minor support around 103.20/102.80. The near-term resistance is 103.85/104.40.
According to the CME Fed watch tool, the probability of a 25 bpbs rate hike in June decreased to 25.2% from 27.5% a day ago.
The US 10-year yield pared some of its gains on profit booking. The US 10 and 2-year spread widened to -71.10% from -79%.
Factors to watch for gold price action-
Global stock market- bullish (negative for gold)
US dollar index - Mixed (neutral for gold)
US10-year bond yield- Bullish (Bearish for gold)
Technical:
The near–term support is around $1935, a break below targets of $1920/$1900.The yellow metal faces minor resistance around $1965, and a breach above will take it to the next level of $1980/$2000/$2020/$2040/$2070/$2100/$2150.
It is good to sell on rallies around $1970 with SL around $1980 for TP of $1920/$1900.


